Up to 4 tickers, drawn as lines that start together at the left edge of the chart, so you see which one moved more (in %).
Turn your phone sideways for a wider chart.
Times in UTC · prices: bidHow to use the chart
Zoom and scroll: drag the chart left or right (finger or mouse) to move in time, with empty room on the right for drawing ahead; Shift + drag selects a period to zoom into, Ctrl + scroll zooms, the + − ‹ › buttons work too. ⟲ or a double-click returns to the latest candles.
Price scale: ↕+ stretches the candles, ↕− flattens them and leaves room above and below for drawings; or drag the price scale on the right up or down (mouse wheel over it works too). ⟲ or a double-tap on the price scale goes back to automatic.
Indicators: press Indicators, pick one; press ⚙ on its chip to change the settings, × to remove it.
Drawing: press Draw, pick a tool and click its points on the chart (or press and drag). On a phone: touch the chart, slide your finger to aim (a magnifier above your finger shows the exact point and its price), lift to place. Click or tap a drawing to select it, then drag it or its handles; Delete removes it, Ctrl + Z undoes, Esc cancels. Magnet snaps to the candles.
Save and alerts: sign in to save an analysis to your account and to get e-mail price alerts. Without an account, indicators and drawings stay on this device.
Replay: Replay, then click a candle (or pick a date): the later candles disappear and ▶ Play brings them back one by one (→ steps, Space plays and pauses). Practise trading on the way with Trade.
Paper trading: Trade buys or sells with virtual money at the live price; stop loss and take profit lines can be dragged on the chart.
Publish an idea: Publish shares this chart (drawings, indicators, period and a picture) with your reasoning and a direction (long, short or neutral) on Ideas; you can attach a strategy anyone can test.
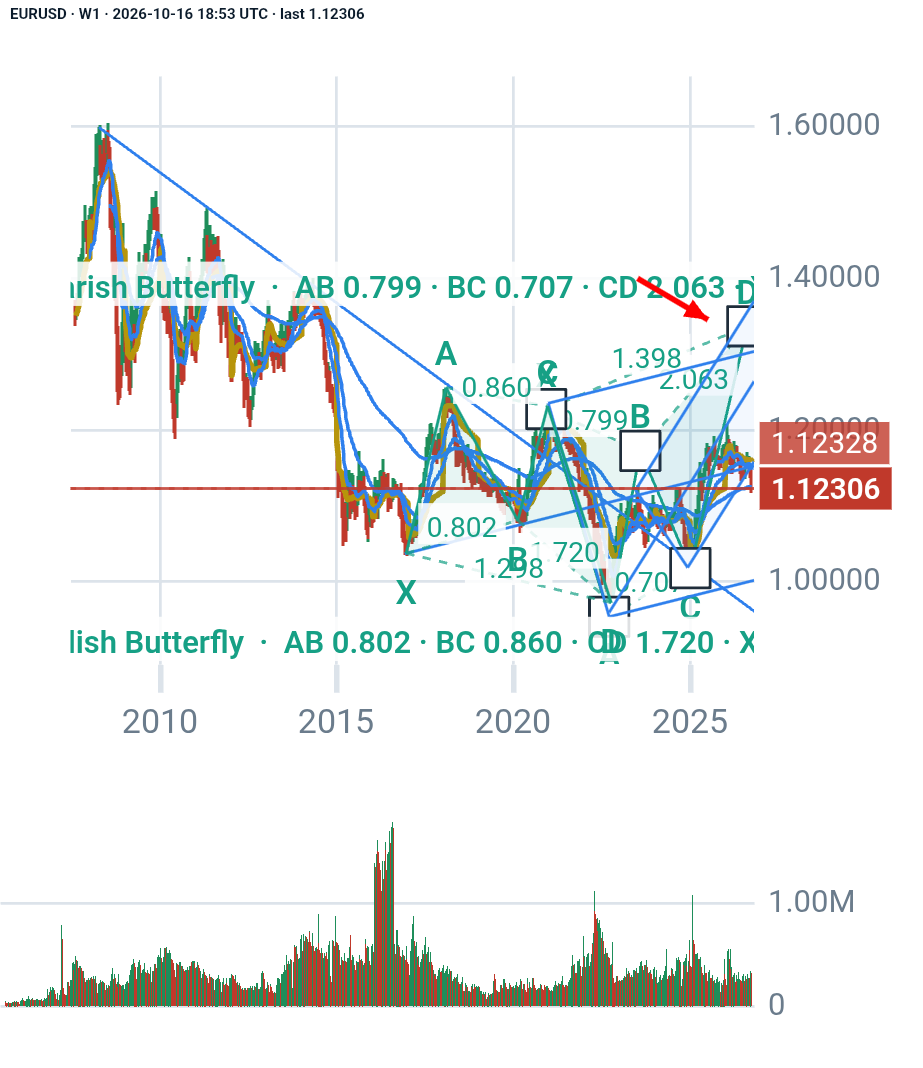
Pattern wizard: ✦ Wizard scans the candles of the timeframe on screen for harmonic patterns (with the zone where point D should complete), Elliott waves, head and shoulders, double tops and bottoms, triangles and wedges, support and resistance and trend lines. Each finding shows the rules it passed, a suggested entry, stop loss and take profits with the risk/reward, and can be shown on the chart or kept as your own drawing. It also suggests indicators that suit the market right now.
Strategy tester: Strategy tests a built-in strategy (moving averages, RSI, Bollinger Bands, MACD, breakouts, SuperTrend) or your own script on past candles: trades appear on the chart, with profit, drawdown, win rate and an equity curve. Edit a copy of any built-in to start your own.
Compare: Compare adds up to 4 other tickers as lines starting together at the left edge, with their % change.
Ask AI: ✦ Ask AI sends a summary of the drawings you tick (prices, times, levels, targets, indicators) to ChatGPT, Claude, Perplexity, Gemini or DeepSeek for a second opinion.
Full screen: the Full screen button (or F) gives the chart the whole screen; Esc leaves it.
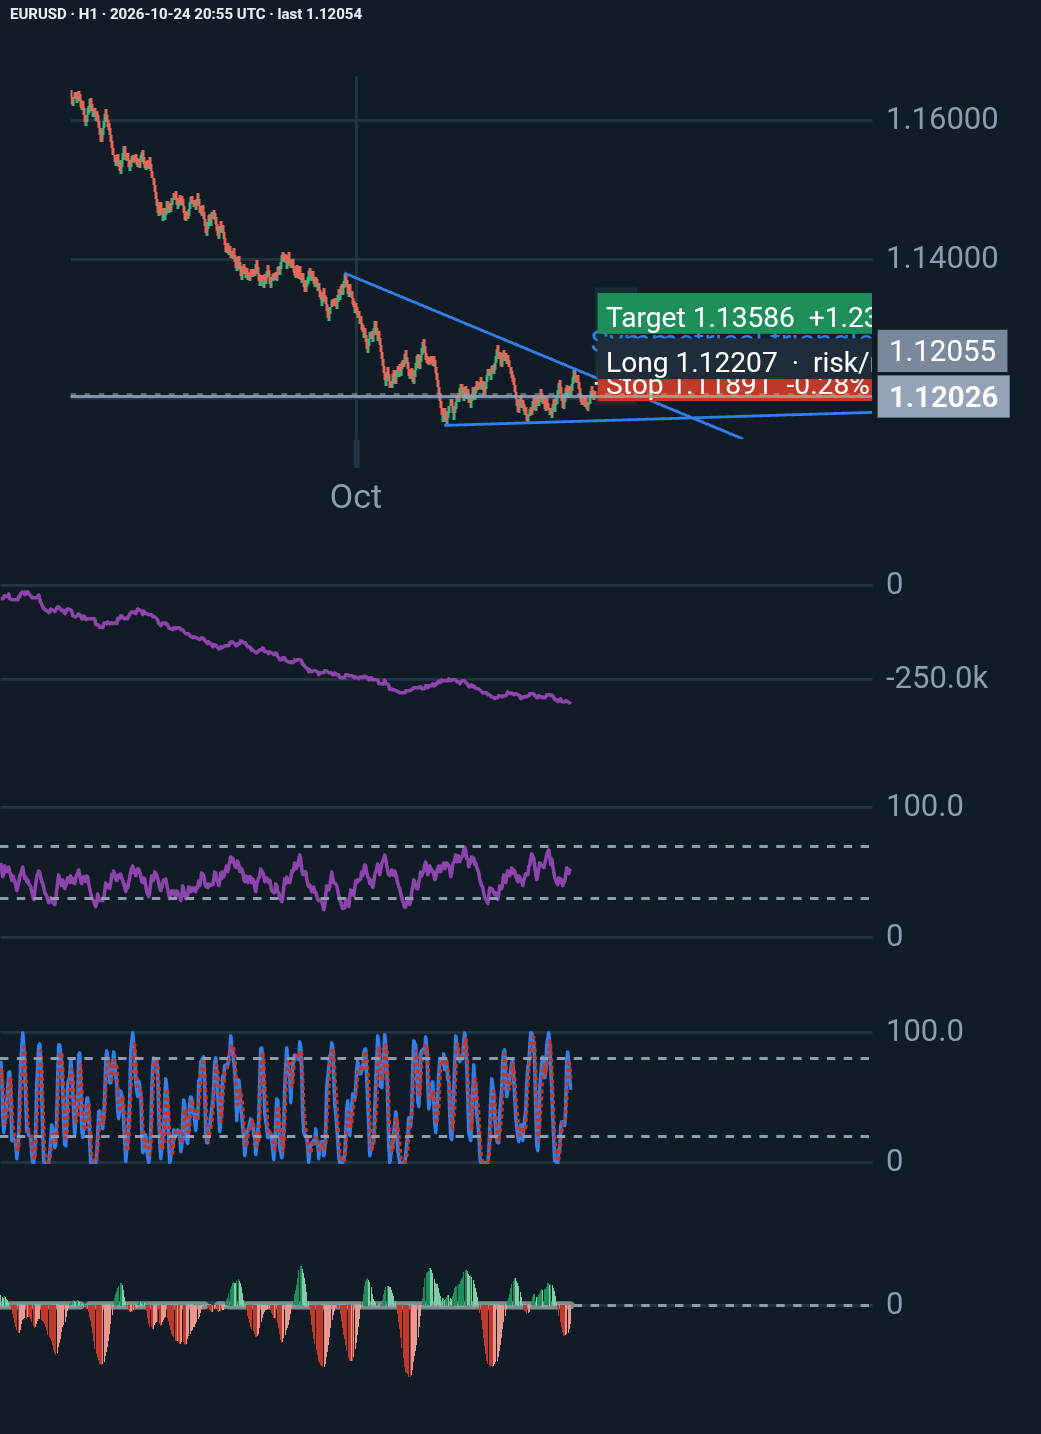
EURUSD remains under strong bearish pressure, with ADX at 45.88 and -DI (24.08) significantly above +DI (10.21).
RSI at 27.06 signals oversold conditions, raising the possibility …
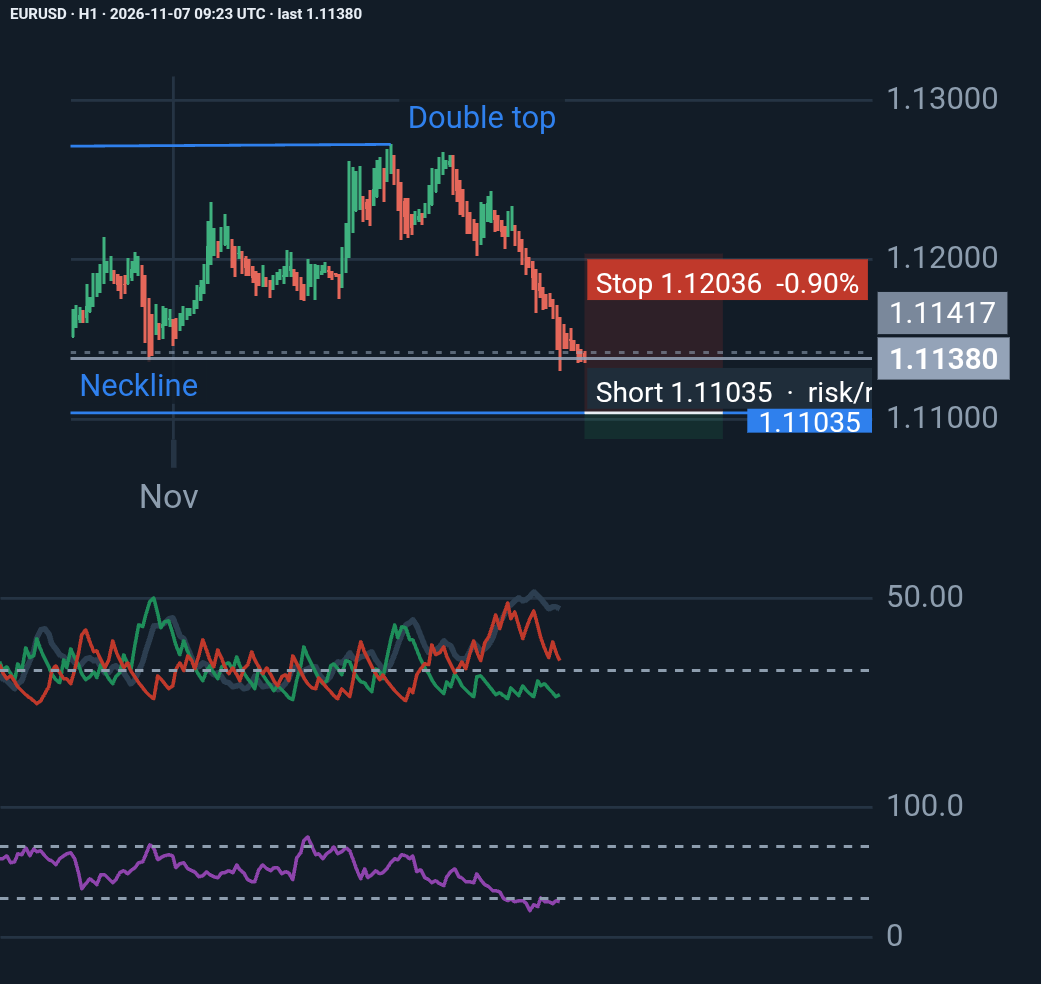
Technical analysis is not just about spotting patterns. It is about understanding the conditions behind them, defining risk, and knowing when a trade thesis is no longer valid.
Wh…
Price since published: -0.70% · in the idea's favour
All EURUSD ideas · draw your own analysis above and press Publish.
EURUSD market summary
EURUSD is the price of one EUR in USD. EURUSD (Euro vs US Dollar) last closed at 1.11542 on 8 November 2026, up 0.15% on the day.
Over the last 388 trading days it moved between 1.11035 (28 Oct 2026) and 1.20810 (26 Jan 2026), and it is 7.67% below that high.
On a typical day its price spans about 0.56% from low to high (20-day average), and 42 of the last 90 sessions closed higher; the largest one-day move in that time was 0.88% on 18 Aug 2026.
1 week-0.28%
1 month-0.43%
3 months-3.33%
6 months-5.33%
1 year-3.54%
Since 1 Jan 2026-4.95%
From the daily candles of this page, updated every few minutes. Not investment advice.
from marketapi import MarketAPI          # marketapi.py from /developers
api = MarketAPI("YOUR_API_KEY")
print(api.latest(["EURUSD"]))
import { MarketAPI } from "./marketapi.mjs";   // from /developers
const api = new MarketAPI({ apiKey: process.env.API_KEY });
console.log(await api.latest(["EURUSD"]));
No key yet? Try the free tier: curl "https://api.marketapi.app/v1/free/prices/latest?symbols=EURUSD"
We use cookies for sign-in and security (always on). With your permission we also use Google Analytics and Google Ads cookies to measure visits and the results of our ads. Details

 Trader
1 day, 17 hours ago
♥ 0 💬 0