Price API
For developers, analysts and spreadsheets
- Latest bid and ask for up to 100 tickers in one call
- OHLC history from 1 minute to monthly, plus tick history
- WebSocket streaming, decimal-string prices, UTC times
Market data platform · Price API · Live charts · On-chain oracle
Ticker price API for developers. One account gives you a clean JSON price API for forex, metals, indices, stocks and crypto, plus free professional charts with 71 indicators, a backtest console, paper trading, price alerts on every channel and a community of traders.
| Ticker | Bid | Ask | Updated |
|---|---|---|---|
| XAUUSDGold / US Dollar | 3843.07 | 3843.26 | live |
| EURUSDEuro / US Dollar | 1.09846 | 1.09858 | live |
| GBPUSDBritish Pound / US Dollar | 1.31984 | 1.31997 | 5s ago |
| USDJPYUS Dollar / Japanese Yen | 159.549 | 159.564 | live |
| XAGUSDSilver / US Dollar | 47.337 | 47.378 | live |
| AUDUSDAustralian Dollar / US Doll… | 0.67340 | 0.67358 | 3s ago |
| USDCADUS Dollar / Canadian Dollar | 1.43050 | 1.43070 | live |
| USDCHFUS Dollar / Swiss Franc | 0.84168 | 0.84188 | live |
Same data as GET /v1/prices/latest · refreshed every second · tap a ticker for its chart · all 1,930 prices
One account, three products
For developers, analysts and spreadsheets
For traders, investors and learners
For DeFi, RWA and smart-contract builders
Everything in one account
Data for your code, charts for your analysis, a console to test strategies, alerts wherever you are and a community to share with. Most of it is free.
Free live charts
Every ticker has a fast, interactive chart right in the browser. The last candle moves with the live price, and every tool comes with a plain-language guide.
Pattern wizard
One click scans the candles on screen. Every pattern comes with the rules it passed, a trade with entry, stop and targets, and its track record on years of history, with the statistics to tell an edge from luck.
How to read a track record · The strategies with the best record
✓ Confirmed by a bullish engulfing
▲ Long 3,995.0 · stop 3,962.4 · T1 4,041.9 (1:1.44) · T2 4,071.0 (1:2.33)
Part of a larger Elliott wave: wave 3 of an impulse up
Risk first
Most accounts are lost to position size, not to bad analysis. Enter your balance, the risk you accept and your stop: the calculator gives the position for it. The full calculator works for every ticker with live prices, pip values and margin.
New on MarketAPI
Interest rate decisions, inflation, jobs, GDP and PMIs for the world's economies: what is coming with a countdown to the next release, and the results with the consensus as soon as they are out. Every time in your own time zone, and on each ticker's page the releases that move it.
Open the calendar →The pattern wizard over every ticker of the markets you choose: only setups at their entry, confirmed by a candle, with a significant record. Pick how many, which markets and the confidence level.
Scan the markets →Every strategy now shows what one trade earned on average, in R and in %, with 90/95/99% intervals. It is called significant only when the win rate and the expected return both beat chance.
How to read it →An entry is confirmed when an engulfing candle, a hammer, a morning star or a strong breakout close forms there. The candles are boxed and named on the chart.
See the candle patterns →Triple tops and bottoms, rectangles, bull and bear flags and pennants, cups with handles, and reversal candles at support and resistance; Elliott waves placed in the larger count up to the primary wave.
Try it on EURUSD →The lot size for the risk you choose, pip value, margin and reward to risk, for every ticker with live prices and real lot sizes.
Size a trade →The phone app's new Tools tab: position calculator, market scan, screener, paper trading and your running tasks.
Get the app →Backtest console
Pick one of six built-in strategies or write your own in a few lines of JavaScript, right on the chart. Every trade appears on the candles, with the profit, drawdown, win rate, profit factor and an equity curve against buy and hold.
ind(), plus moving averages, RSI, ATR, MACD, bands and crossoversconst fast = ta.ema(close, input("Fast EMA", 12, { min: 2, max: 200 }));
const slow = ta.ema(close, input("Slow EMA", 26, { min: 3, max: 400 }));
plot(fast, "Fast", "#2F80ED");
plot(slow, "Slow", "#E39B2D");
function onBar(i) {
if (ta.crossover(fast, slow, i)) long();
if (ta.crossunder(fast, slow, i)) short();
}
The charts stay free. Pro and Pro+ add many more wizard scans, longer back-tests and first place in the queue, at about half the price of the best-known charting platforms.
See the plans →Give your clients Premium charts at 30% off: buy seats, hand out one-time codes with your own client references, by hand or through the partner API.
The partner programme →Share your link: for 12 months you get 20% of what the people you invite top up, added to your balance.
Get your link →Trading ideas
Traders publish their analysis with the chart, their reasoning and sometimes a strategy you can test. Open any idea on the live chart, like it, comment and follow the authors you trust.
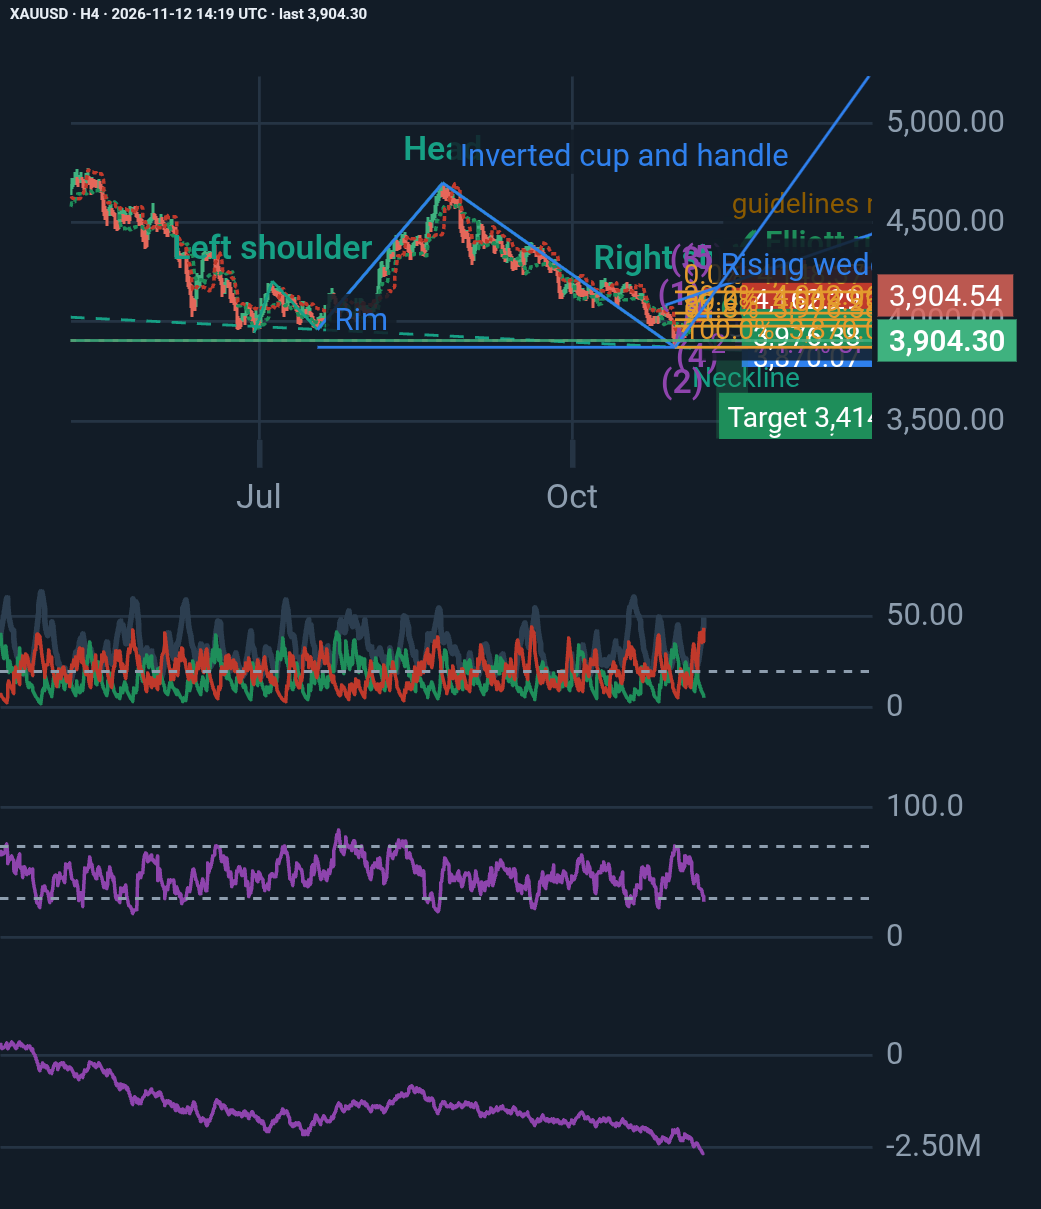
Gold remains under significant bearish pressure, trading around 3,891.14. Key technical observations: - ADX at 49.43 confirms a strong trend, with −DI (44.07) substantially above…
 Trader
5 days, 9 hours ago
♥ 0 💬 0
Price since published: -1.59% · in the idea's favour
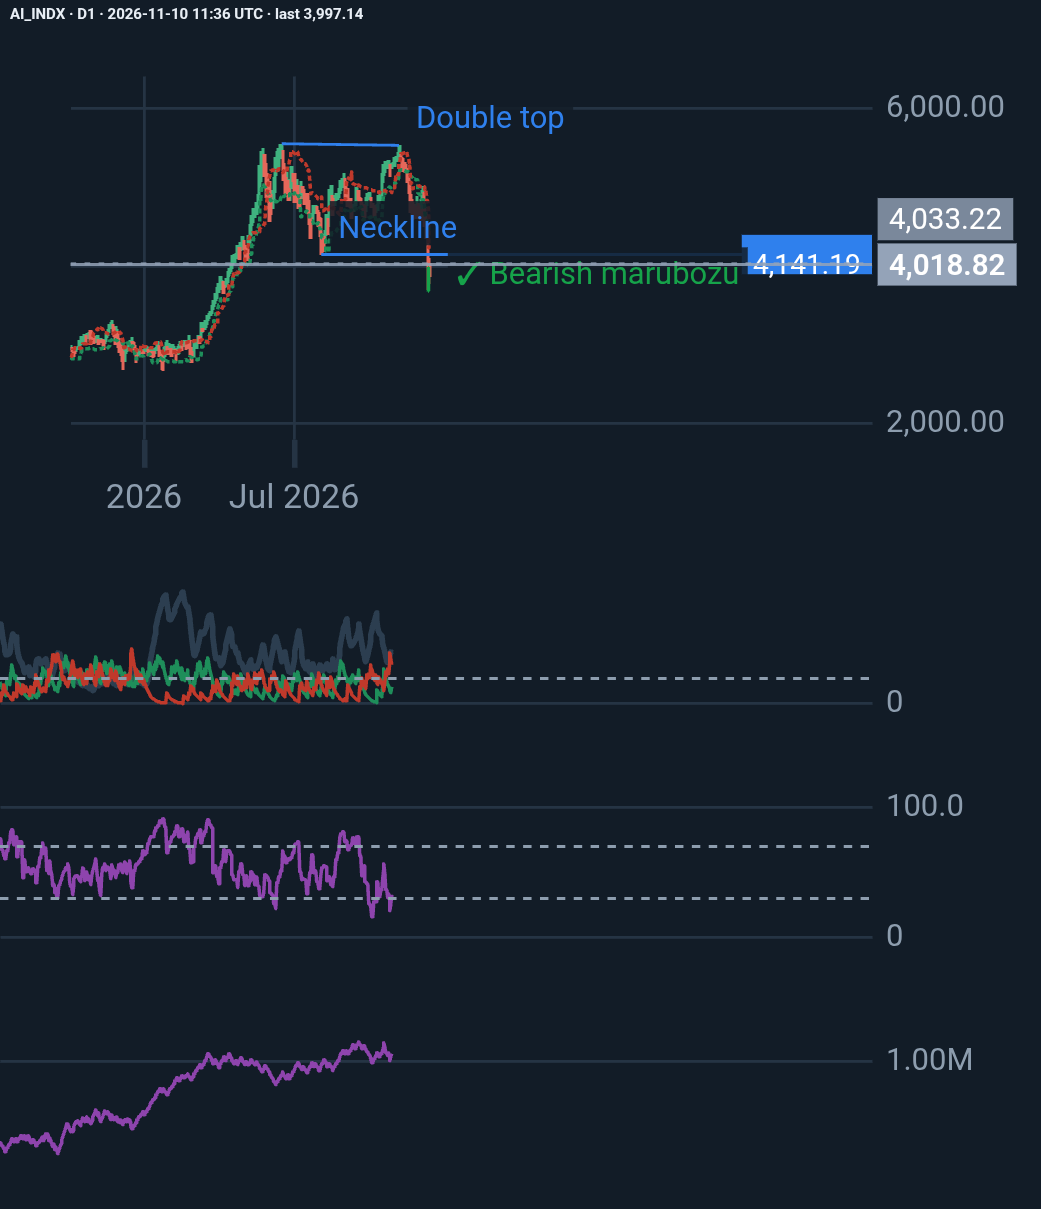
AI-related stocks remain under significant selling pressure. The D1 chart shows a confirmed double-top pattern, bearish momentum, and a strong downtrend (ADX 40.32). RSI at 32.69 …
Trader
1 week ago
♥ 0 💬 0
Price since published: -6.06% · in the idea's favour
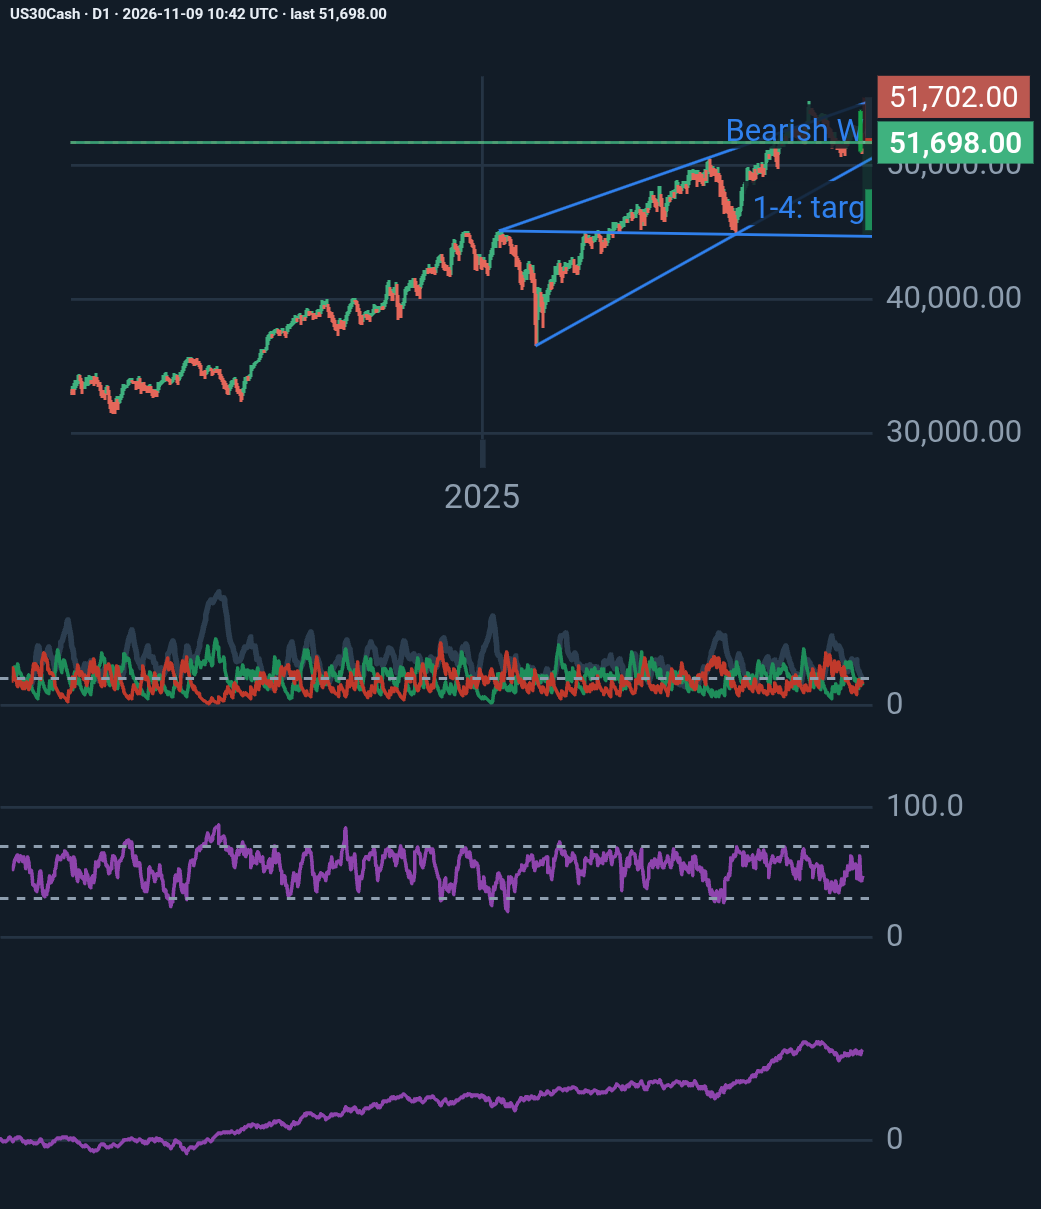
DJI is showing signs of weakening momentum, with ADX below 20 and RSI below 50. A bearish Wolfe Wave confirmed by a bearish engulfing suggests potential downside, but the weekly tr…
Trader
1 week, 1 day ago
♥ 0 💬 0
Price since published: -1.53% · in the idea's favour
Trading clubs
Join a public club to see members' analyses, talk about the markets and share your own levels, or start a private club for your team.
For developers
curl -H "Authorization: Bearer $KEY" \
  "https://api.marketapi.app/v1/prices/latest?symbols=EURUSD,XAUUSD"
import requests
r = requests.get("https://api.marketapi.app/v1/prices/latest",
params={"symbols": "EURUSD,XAUUSD"},
headers={"Authorization": f"Bearer {KEY}"})
for q in r.json()["data"]:
print(q["symbol"], q["bid"], q["ask"], q["status"])const r = await fetch(
"https://api.marketapi.app/v1/prices/latest?symbols=EURUSD,XAUUSD",
{ headers: { Authorization: `Bearer ${KEY}` } });
const { data } = await r.json();
data.forEach(q => console.log(q.symbol, q.bid, q.ask, q.status));No signup needed
Search for a ticker, then run it in the shell. Every answer is the real JSON the API returns, along with the matching curl command.
symbols gold.price EURUSD,XAUUSD to see bid, ask, time and status.status EURUSD tells you whether the market is LIVE or MARKET_CLOSED.Show live rates and charts in a fintech app, a portfolio tracker or an internal dashboard, with one consistent JSON format.
Pull years of OHLC candles for back-testing, then stream live quotes into your strategy over WebSocket.
Refresh prices in Google Sheets or Excel with one URL. Pay a few credits instead of a monthly data bill.
Mark up a chart with Fibonacci, Elliott waves or harmonics, save it, and get an e-mail when price reaches your level.
Bring forex and gold prices on-chain for lending, synthetic assets and stablecoin FX, with signatures your contract can check.
Every indicator and drawing tool has a free guide in plain language: the idea, the formula, an example and its history.
The website, the app, the e-mails and your alerts are available in 10 languages, right-to-left scripts included. Every page has its own address in each language, so you can share a link in the language of the person you send it to.
Change the language at any time at the foot of every page or in the app's Account.
Prices are refreshed every second and marked LIVE. When a market is shut, the quote says MARKET_CLOSED, so a weekend price is never passed off as a live one.
Prepaid credits, with free credits used first. You are only charged for data you actually receive.
Plain REST and JSON, decimal-string prices, UTC timestamps, safe retries, WebSocket streaming and clear error messages.
Hashed API keys with scopes and IP allow-lists, two-factor sign-in, and an append-only billing ledger.
Versioned endpoints and visible rate limits instead of a scraper that breaks when a web page changes. Compare with Yahoo Finance.
USDT and USDC on Ethereum, BNB Chain, Arbitrum, Optimism, Base and Solana. Scan a QR code with MetaMask, Trust Wallet, Phantom or Coinbase Wallet.
Start free with no signup. When your project goes live, a key unlocks history, streaming, the on-chain oracle and far higher limits. Sign up and the first 1,000 credits are on us.
| Feature | Free$0 · no key | RecommendedFull access$1 / 1,000 credits |
|---|---|---|
| Latest prices (bid, ask, time, status) | ✓ | ✓ |
| Price freshness | Real-time | Real-time, refreshed every second |
| Tickers | All 1,930 | All 1,930: forex, metals, indices, stocks, crypto |
| Tickers per request | Up to 5 | Up to 100 |
| Rate limit | 10/min · 1,000/day per IP | 600/min · 20,000/hour per key (up to 10× on monthly plans) |
| Historical OHLC candles (1 minute to monthly) | — | ✓ up to 10,000 rows per call |
| Tick history | — | ✓ |
| WebSocket streaming | — | ✓ live quotes pushed to you |
| On-chain oracle: signed reports for smart contracts | — | ✓ verified on-chain, free testnet |
| Charts, saved analyses and e-mail price alerts | — | ✓ free with any account |
| Instrument specifications (contract size, digits, sessions) | — | ✓ |
| Own API keys, IP allow-lists, test keys | — | ✓ |
| Usage dashboard, receipts, safe retries | — | ✓ |
| Support | Docs | Support tickets by e-mail |
| Try it now | Get 1,000 free creditsPlans from $19/month · compare |
Pay only for data you receive: 1 credit per latest price, 1 credit per 1000 history rows. No subscription needed: top up when you want, or choose a monthly plan.
For smart contracts
Bring forex, gold, index and stock prices on-chain for DeFi lending, tokenized assets (RWA), on-chain FX, stablecoin payments and synthetic assets. Your app fetches a signed price report from the API; your contract hands it to our verifier, which checks the signature on-chain. The price can't be forged in transit.
latestRoundData) and Solidity and JavaScript examples, live on Optimism with a free testnet.Yes. New accounts receive 1000 free credits after confirming their email, and the public free tier lets you try the API without a key.
Forex, metals, indices, energies, stock CFDs and crypto, as offered by our data feed. Download the ticker list.
JSON with decimal-string prices, UTC timestamps and a freshness status for every quote.
Yes. It is a documented REST API with API keys and usage-based pricing, not a scraper. It is not affiliated with Yahoo.
Yes. The same prices are available as signed reports for smart contracts. Your contract verifies the signature on-chain, every report carries the market status and expires after about a minute, and a Chainlink-compatible adapter is available. How the oracle works.
Yes. Every ticker has a free interactive chart with 71 professional indicators and 51 drawing tools, plus Elliott waves and harmonic patterns. With a free account you can save your analyses and get alerts by e-mail, Telegram or push when a price reaches your level. See what the charts can do.
Yes. The pattern wizard scans the candles on screen for harmonic patterns (with the zone where point D should complete), Elliott waves, head and shoulders, double tops and bottoms, triangles, support and resistance and trend lines. It shows the rules each one passed and suggests an entry, stop loss and take profits with the risk/reward. It is automatic analysis, not advice. How it works.
Every strategy the wizard suggests is back-tested on the history of the most used tickers, exactly as the chart looked then. You see how often target 1 came before the stop against the win rate it needs to break even, and the expected return per trade with 90, 95 and 99% confidence intervals. It is called significant only when a binomial test of the win rate and a t-test and a bootstrap of the expected return all agree, corrected for the many strategies tested. The guide.
Yes. The market scan (Pro+) runs the wizard over every ticker of the markets you choose and lists only the setups that are at their entry now, confirmed by a candle and significant at your level. It uses computing time, counted only while it runs. Market scan.
Decide the risk first (many traders use 0.5 to 2% of the balance per trade), then the stop. The position size calculator turns both into a lot size for any ticker, with the pip value and the margin.
Yes. Partners buy seats at 30% off and hand out one-time activation codes, by hand or through the partner API, with 5 free trial seats to start.
Yes. The backtest console on every chart runs built-in strategies or your own JavaScript over up to 20,000 candles and shows every trade, the drawdown and an equity curve. Orders fill at the next candle's open, so there is no look-ahead. The complete guide with examples.
Yes, for iPhone and Android, with live watchlists, the full chart and alerts as notifications. Get the app.
Top up with USDT or USDC on Ethereum, BNB Smart Chain, Arbitrum, Optimism, Base or Solana. Free credits are always used first.
Automatic pattern recognition scans price swings the way an analyst would, then checks every pattern against textbook rules and its own tra…
Tokenized real-world assets need trustworthy prices on-chain. Here is how signed pull oracles deliver them safely, including outside market…
yfinance is great for quick experiments, but it can break without warning. Here are the alternatives for production Python code, and how to…
Live watchlists, the full chart and price alerts as notifications, on iPhone and Android. More about the app.
Free account, 1000 free credits, free charts and alerts. No card, no subscription.