Forex

GBPUSD price & chart

Great Britain Pound vs US Dollar

Bid1.33192
Ask1.33215
Spread—
Updating 2026-10-27T07:10:33.597000Z

GBPUSD chart

+0.99%

GBPUSD daily closing prices, last 90 days1.320001.340001.3600024 Jun15 Jul05 Aug26 Aug16 Sep07 Oct

Turn your phone sideways for a wider chart.

Times in UTC · prices: bid
How to use the chart
  • Zoom and scroll: drag the chart left or right (finger or mouse) to move in time, with empty room on the right for drawing ahead; Shift + drag selects a period to zoom into, Ctrl + scroll zooms, the + − ‹ › buttons work too. ⟲ or a double-click returns to the latest candles.
  • Price scale: ↕+ stretches the candles, ↕− flattens them and leaves room above and below for drawings; or drag the price scale on the right up or down (mouse wheel over it works too). ⟲ or a double-tap on the price scale goes back to automatic.
  • Indicators: press Indicators, pick one; press ⚙ on its chip to change the settings, × to remove it.
  • Drawing: press Draw, pick a tool and click its points on the chart (or press and drag). On a phone: touch the chart, slide your finger to aim (a magnifier above your finger shows the exact point and its price), lift to place. Click or tap a drawing to select it, then drag it or its handles; Delete removes it, Ctrl + Z undoes, Esc cancels. Magnet snaps to the candles.
  • Save and alerts: sign in to save an analysis to your account and to get e-mail price alerts. Without an account, indicators and drawings stay on this device.
  • Replay: Replay, then click a candle (or pick a date): the later candles disappear and ▶ Play brings them back one by one (→ steps, Space plays and pauses). Practise trading on the way with Trade.
  • Paper trading: Trade buys or sells with virtual money at the live price; stop loss and take profit lines can be dragged on the chart.
  • Publish an idea: Publish shares this chart (drawings, indicators, period and a picture) with your reasoning and a direction (long, short or neutral) on Ideas; you can attach a strategy anyone can test.
  • Pattern wizard: ✦ Wizard scans the candles of the timeframe on screen for harmonic patterns (with the zone where point D should complete), Elliott waves, head and shoulders, double tops and bottoms, triangles and wedges, support and resistance and trend lines. Each finding shows the rules it passed, a suggested entry, stop loss and take profits with the risk/reward, and can be shown on the chart or kept as your own drawing. It also suggests indicators that suit the market right now.
  • Strategy tester: Strategy tests a built-in strategy (moving averages, RSI, Bollinger Bands, MACD, breakouts, SuperTrend) or your own script on past candles: trades appear on the chart, with profit, drawdown, win rate and an equity curve. Edit a copy of any built-in to start your own.
  • Compare: Compare adds up to 4 other tickers as lines starting together at the left edge, with their % change.
  • Ask AI: ✦ Ask AI sends a summary of the drawings you tick (prices, times, levels, targets, indicators) to ChatGPT, Claude, Perplexity, Gemini or DeepSeek for a second opinion.
  • Full screen: the Full screen button (or F) gives the chart the whole screen; Esc leaves it.
Multi-chart Learn the indicators and tools

GBPUSD trading ideas

GBPUSD · W1 Short

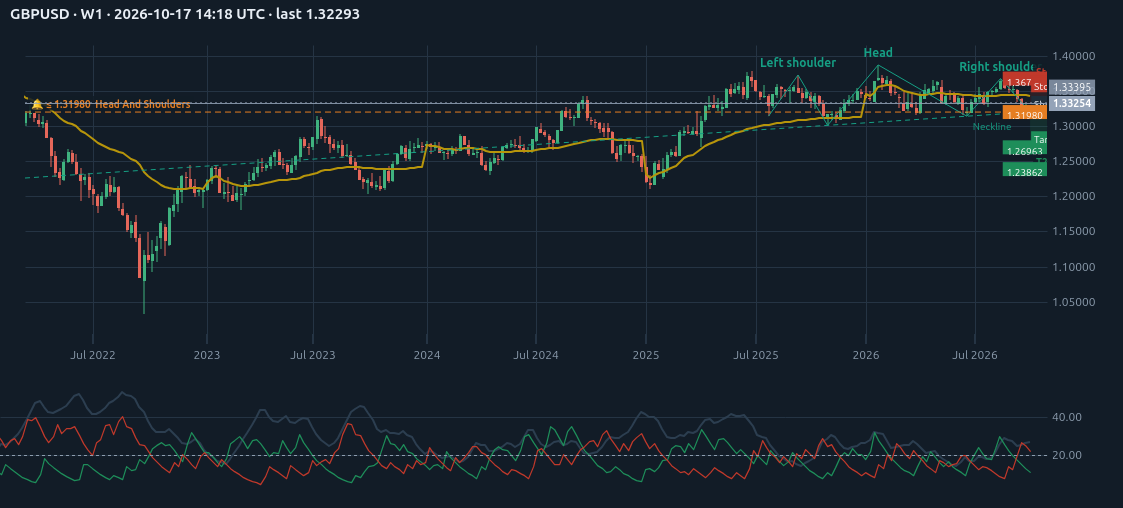
GBPUSD W1 analysis

Watch the neckline at 1.31981 · small swings ▼ Short 1.31981 · stop order (on the breakout) Stop 1.37144 (3.91%)T1 1.26963 · R:R 1:0.97T2 1.23862 · R:R 1:1.57 Entry on a close thro…

Reza E. 1 week, 2 days ago ♥ 0 💬 0

Price since published: -0.05% · in the idea's favour

All GBPUSD ideas · draw your own analysis above and press Publish.

GBPUSD market summary

GBPUSD is the price of one GBP in USD. GBPUSD (Great Britain Pound vs US Dollar) last closed at 1.33190 on 26 October 2026, down 0.10% on the day. Over the last 396 trading days it moved between 1.30090 (4 Nov 2025) and 1.38682 (26 Jan 2026), and it is 3.96% below that high. On a typical day its price spans about 0.52% from low to high (20-day average), and 46 of the last 90 sessions closed higher; the largest one-day move in that time was 1.17% on 14 Jul 2026.

1 week-0.44%
1 month+0.57%
3 months+0.24%
6 months-1.44%
1 year-0.1%
Since 1 Jan 2026-0.98%

From the daily candles of this page, updated every few minutes. Not investment advice.

Get the GBPUSD price with the API

Latest price

curl -H "Authorization: Bearer $API_KEY" \
  "https://api.marketapi.app/v1/prices/latest?symbols=GBPUSD"

Daily candles (OHLC)

curl -H "Authorization: Bearer $API_KEY" \
  "https://api.marketapi.app/v1/bars?symbol=GBPUSD&timeframe=D1&from=2026-01-01T00:00:00Z&to=2026-12-31T00:00:00Z"

No key yet? Try the free tier: curl "https://api.marketapi.app/v1/free/prices/latest?symbols=GBPUSD"

Get a free API key API docs

About GBPUSD

NameGreat Britain Pound vs US Dollar
MarketForex
Decimals5
CategoryForex/Standard/Majors
ExchangeXCCY
Base currencyGBP
Profit currencyUSD
Margin currencyGBP
Point (price step)0.00001
Tick size0.00001
DataLatest price, ticks, candles from 1 minute to monthly, WebSocket stream

On-chain price feed

GBPUSD is also available as a signed price feed that smart contracts verify on-chain.

feedId 0xd30842147b60fe333c2700bcae5eee6815b8529847955d19522858806bca8217

How the oracle works · Integration guide

Related tickers

AUDUSDEURGBPEURUSDNZDUSDUSDCADUSDCHFUSDCNHUSDDKKUSDHKDUSDHUFUSDJPYUSDMXNUSDNOKUSDPLNUSDSEKUSDSGD