
USD/JPY H4 Analysis: A Bullish Reversal or Just a Temporary Recovery?
 Open on the live chart ↗
Price when published: 157.452000 · now 157.849000 (+0.25%, in the idea's favour)
USD/JPY is showing signs of short-term bullish momentum, but the bigger picture still calls for caution.
Here are the key observations from my latest technical analysis:
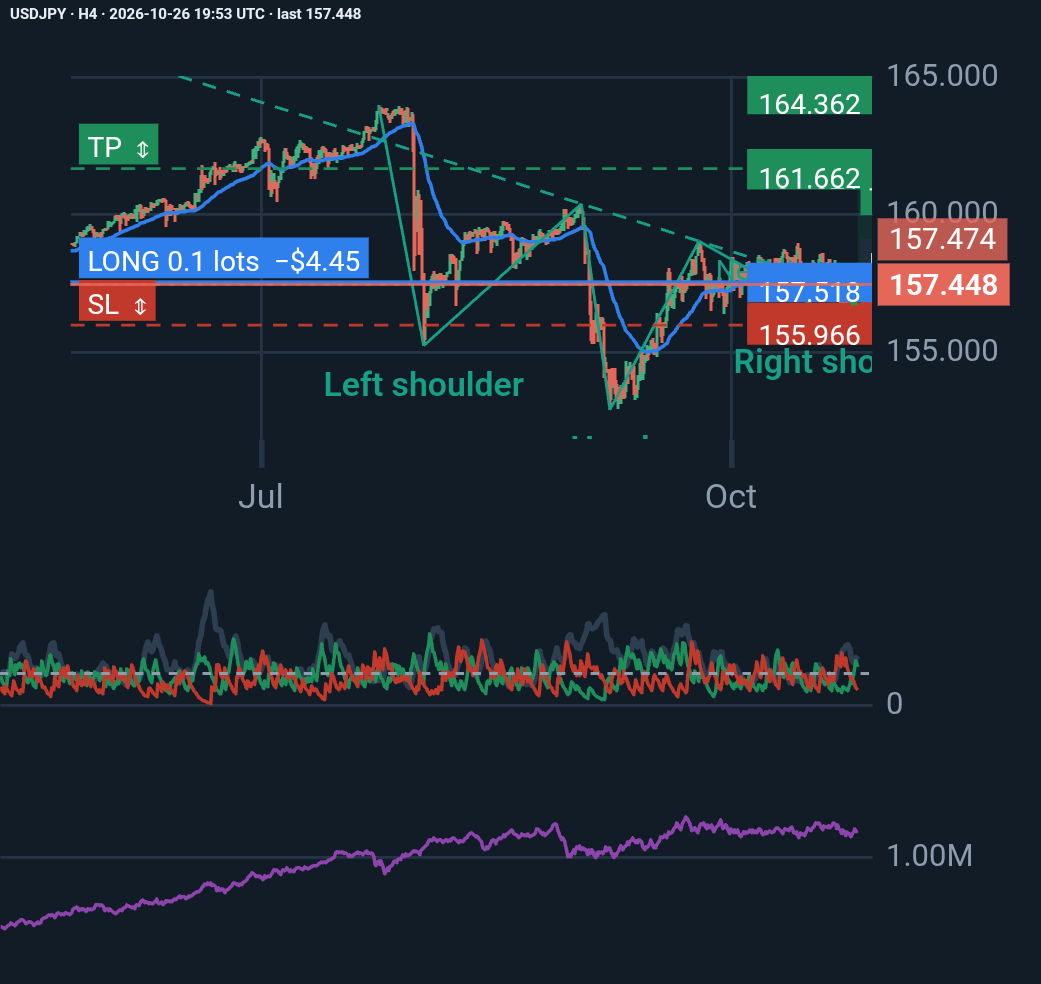
📈 1. Inverse Head and Shoulders
The chart shows a potential inverse head-and-shoulders pattern, suggesting a possible bullish reversal. However, price is still below the key neckline, so confirmation remains important.
📊 2. Momentum Indicators
• ADX: 31.18, indicating a strong trend.
• +DI: 24.44 vs. -DI: 9.74, showing that buyers currently have the directional advantage.
• EMA 50: Around 157.600, acting as an important near-term resistance level.
🎯 3. Key Price Levels
• Resistance: 157.600, followed by 157.850–158.000.
• Major neckline resistance: 159.024–160.381.
• Support: 156.570–156.066.
• A break below 155.966 would invalidate my proposed long trade setup.
🚀 Bullish Scenario:
A sustained H4 close above the EMA, followed by a successful breakout and retest, could strengthen the case for further upside.
⚠️ Bearish Scenario:
Rejection at resistance and a break below the right shoulder could signal renewed selling pressure.
One more factor deserves attention: upcoming Federal Reserve and Bank of Japan decisions could increase volatility and create sharp moves in USD/JPY.
My takeaway: A promising technical setup is not the same as a confirmed trade. Price action, risk management, and macroeconomic context must work together.
The key question is whether buyers can turn this recovery into a sustainable reversal.
What is your view on USD/JPY? Are we seeing the beginning of a bullish reversal, or is this just a temporary pullback within a broader downtrend?
#USDJPY #ForexTrading #TechnicalAnalysis #PriceAction #RiskManagement #ForexMarket
More from Reza E.
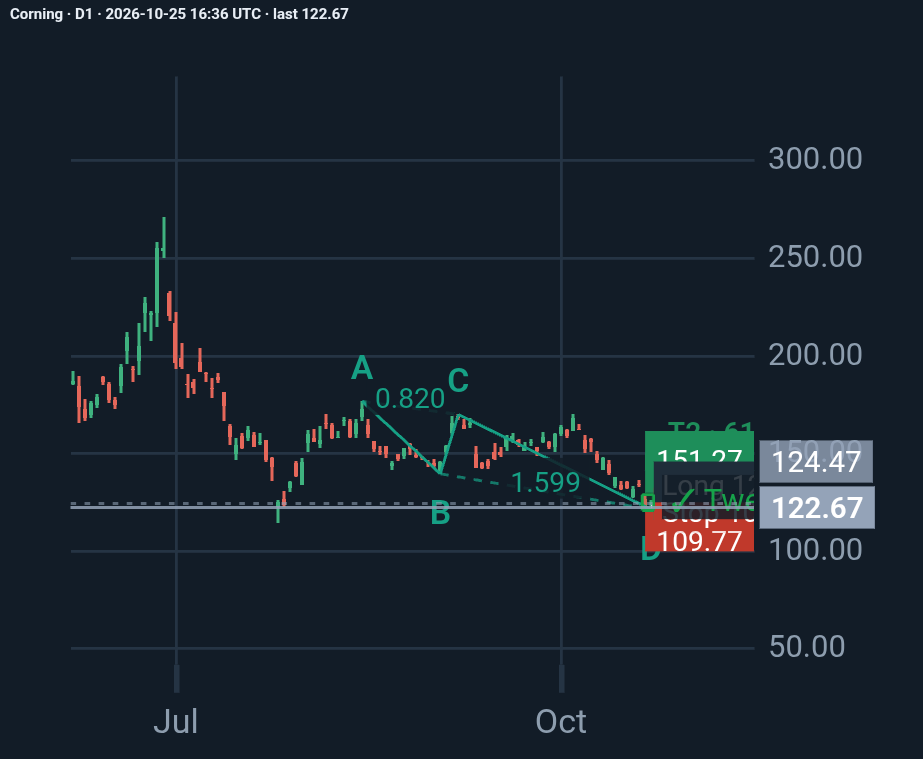
Corning D1 analysis
Corning Inc. (GLW) | Daily Chart Analysis: A Potential Bullish Reversal? Corning is approaching an important technical decision point, with a potential bullish AB=CD harmonic patt…
Reza E. 1 day, 15 hours ago ♥ 0 💬 0
Price since published: +3.45% · in the idea's favour
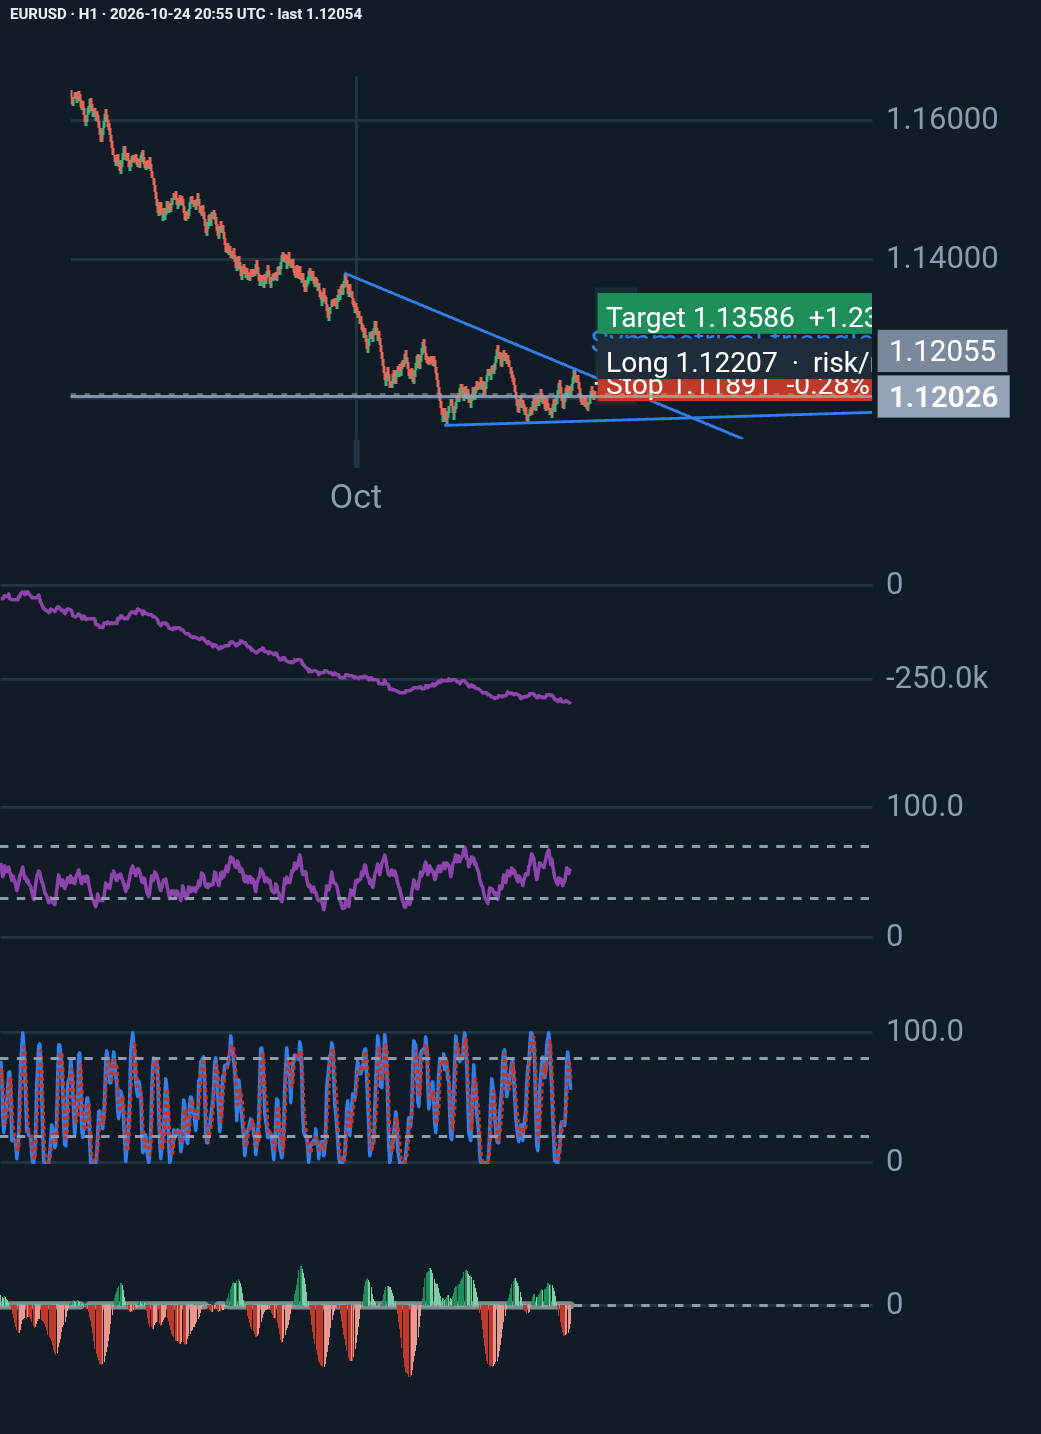
EUR/USD H1: A Promising Triangle Setup, but Is the Breakout Worth Trading?
Technical analysis is not just about spotting patterns. It is about understanding the conditions behind them, defining risk, and knowing when a trade thesis is no longer valid. Wh…
Reza E. 2 days, 11 hours ago ♥ 0 💬 0
Price since published: -0.42% · against the idea
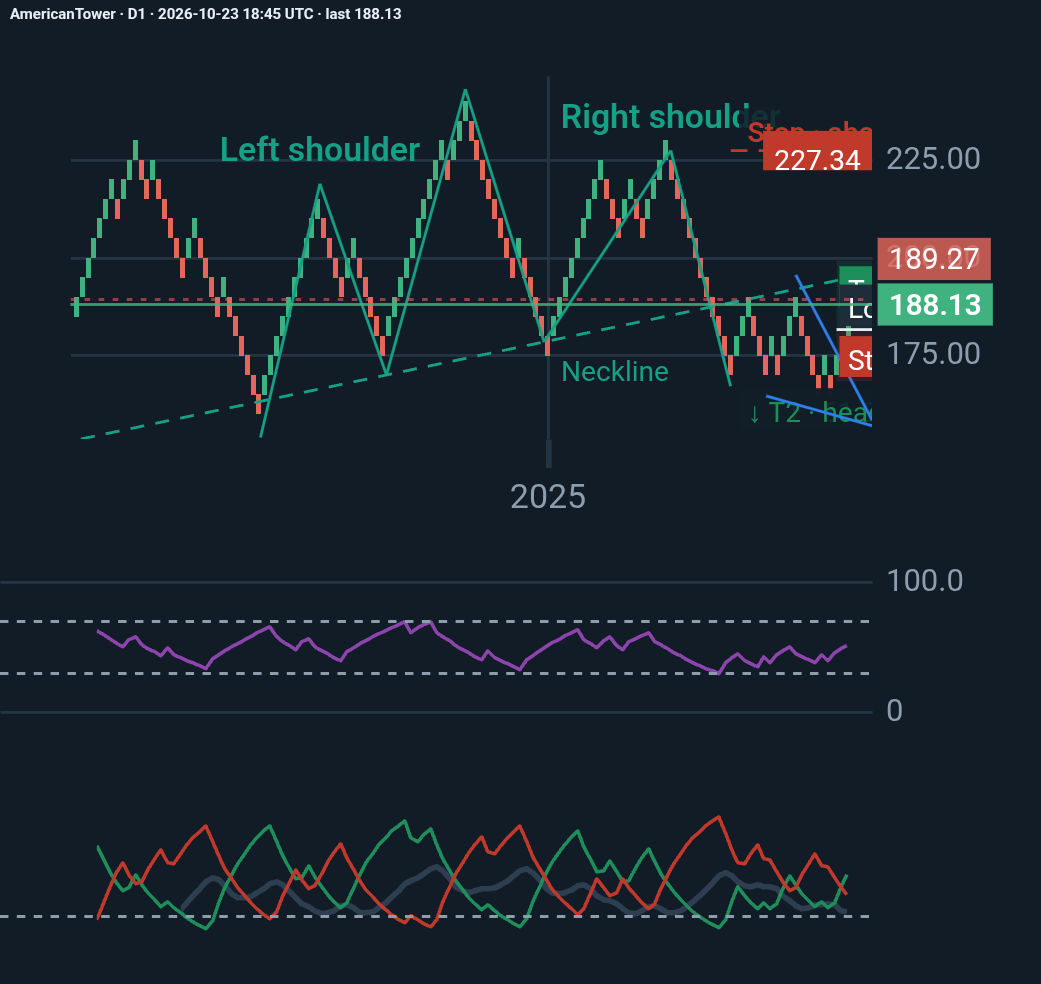
AmericanTower D1 analysis
American Tower (AMT): A recovery within a potentially bearish structure. American Tower is showing improving short-term momentum, but the broader technical picture remains uncerta…
Reza E. 3 days, 13 hours ago ♥ 0 💬 0
Price since published: -0.21%
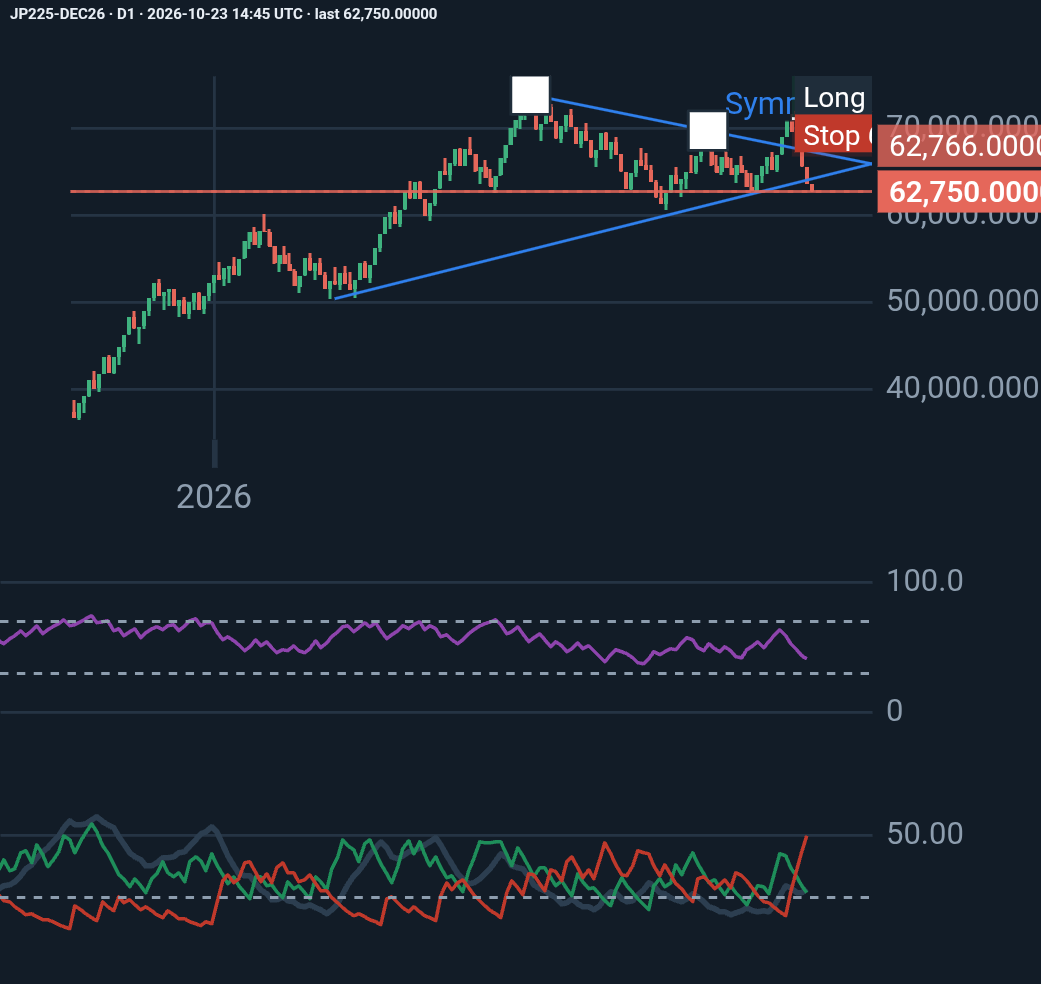
JP225-DEC26 D1 analysis
JP225-DEC26 Technical Outlook 📊 The Nikkei 225 futures chart shows increasing bearish pressure, with RSI at 41.82 and −DI significantly above +DI. Price is approaching a key suppo…
Reza E. 3 days, 17 hours ago ♥ 0 💬 0
Price since published: +1.29% · against the idea
Ideas are the author's opinion, not investment advice. Past moves do not predict future ones.
Comments 0
Sign in or create a free account to like, follow and comment.