
Corning D1 analysis
 Open on the live chart ↗
Price when published: 122.670000 · now 126.900000 (+3.45%, in the idea's favour)
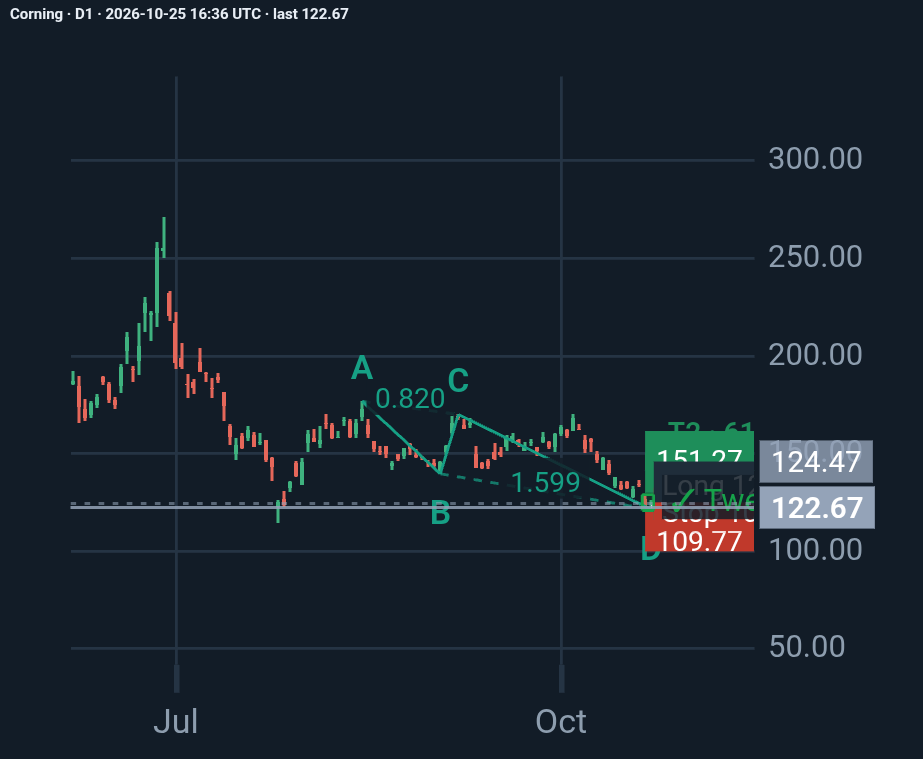
Corning Inc. (GLW) | Daily Chart Analysis: A Potential Bullish Reversal?
Corning is approaching an important technical decision point, with a potential bullish AB=CD harmonic pattern forming near the $121 area.
Based on the latest available daily chart data, GLW closed at $122.67 on October 22, 2026, after reaching an intraday low of $121.20.
Here are the key technical levels and scenarios I’m watching:
• Potential reversal zone: $120.64–$121.20
• First upside target: $139.78
• Second upside target: $151.27
• Proposed risk-management levels: $109.02–$109.77
The bullish AB=CD pattern has a reported quality score of 91/100 from the pattern-analysis tool. Its historical backtest also reports a 56% rate of reaching the first target before the stop across 1,274 trades. These statistics are encouraging, but they do not guarantee the outcome of this particular setup.
A potential tweezer bottom adds to the reversal thesis, although the underlying candle data should be verified before treating it as confirmed.
What would strengthen the bullish case?
A sustained hold above the $120–$121 support region, followed by a recovery above $128.79, would provide additional evidence that buyers are regaining control. A break above the $139–$140 resistance zone could open the way toward $151.27.
What could invalidate the setup?
A decisive breakdown below the recent low would weaken the reversal thesis. The proposed stop region near $109–$110 represents a deeper risk-control level, not a guarantee against losses.
One additional factor deserves attention: Corning's scheduled earnings release on October 27 could introduce significant volatility and gap risk.
My view: GLW presents an interesting potential reversal opportunity, but confirmation matters more than the pattern itself. Price action around support, resistance, and the upcoming earnings announcement will be critical.
Technical analysis is about probabilities, risk management, and disciplined execution—not certainty.
What is your view on GLW? Will buyers defend the $121 area and push toward $140, or is another leg lower more likely?
#Corning #GLW #TechnicalAnalysis #StockMarket #HarmonicPatterns #PriceAction #Trading #RiskManagement
More from Reza E.
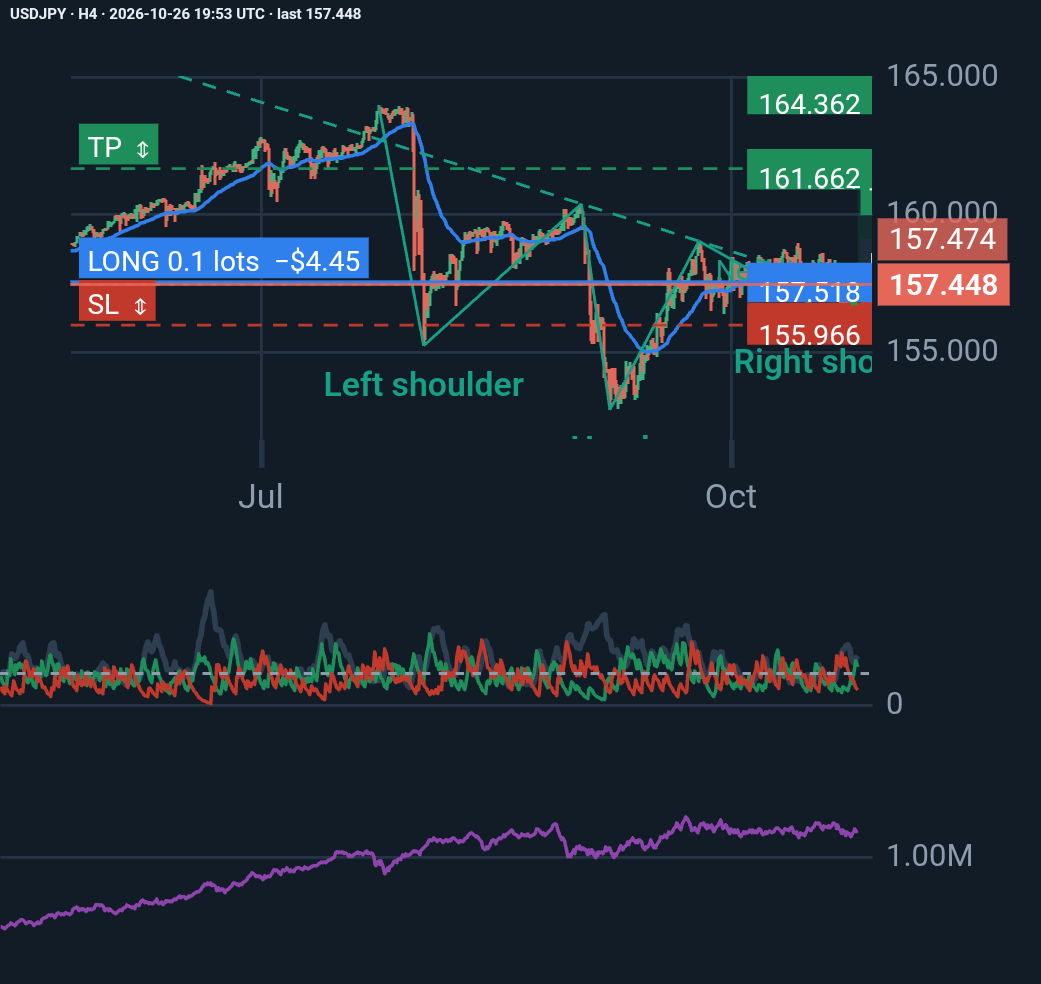
USD/JPY H4 Analysis: A Bullish Reversal or Just a Temporary Recovery?
USD/JPY is showing signs of short-term bullish momentum, but the bigger picture still calls for caution. Here are the key observations from my latest technical analysis: 📈 1. Inv…
Reza E. 12 hours, 15 minutes ago ♥ 0 💬 0
Price since published: +0.25% · in the idea's favour
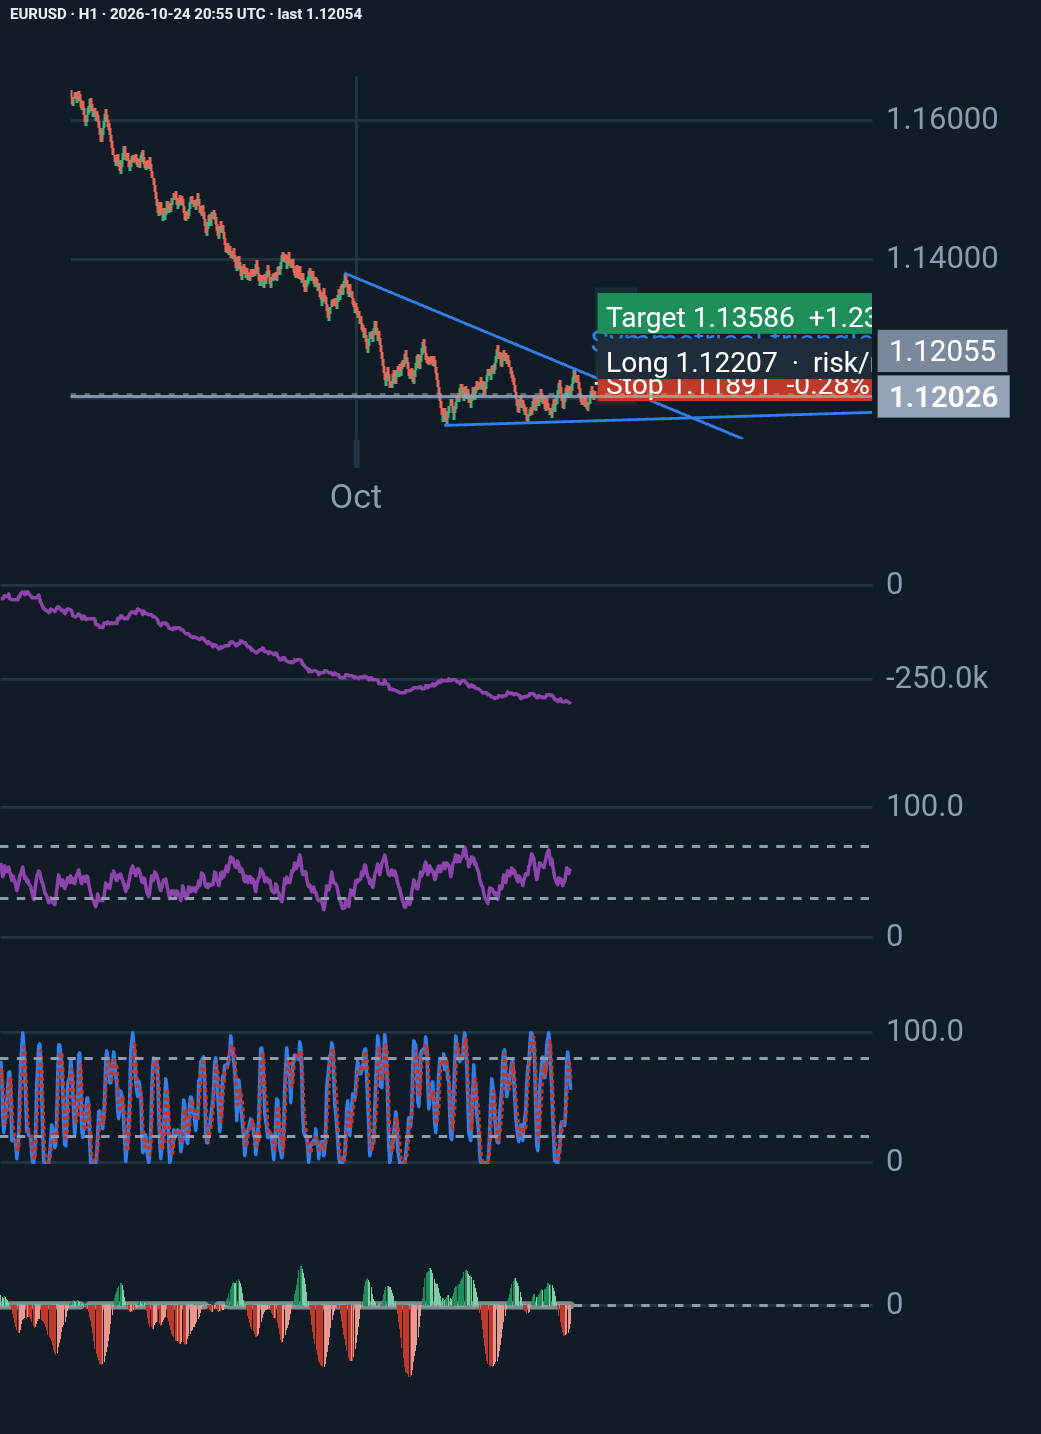
EUR/USD H1: A Promising Triangle Setup, but Is the Breakout Worth Trading?
Technical analysis is not just about spotting patterns. It is about understanding the conditions behind them, defining risk, and knowing when a trade thesis is no longer valid. Wh…
Reza E. 2 days, 11 hours ago ♥ 0 💬 0
Price since published: -0.41% · against the idea
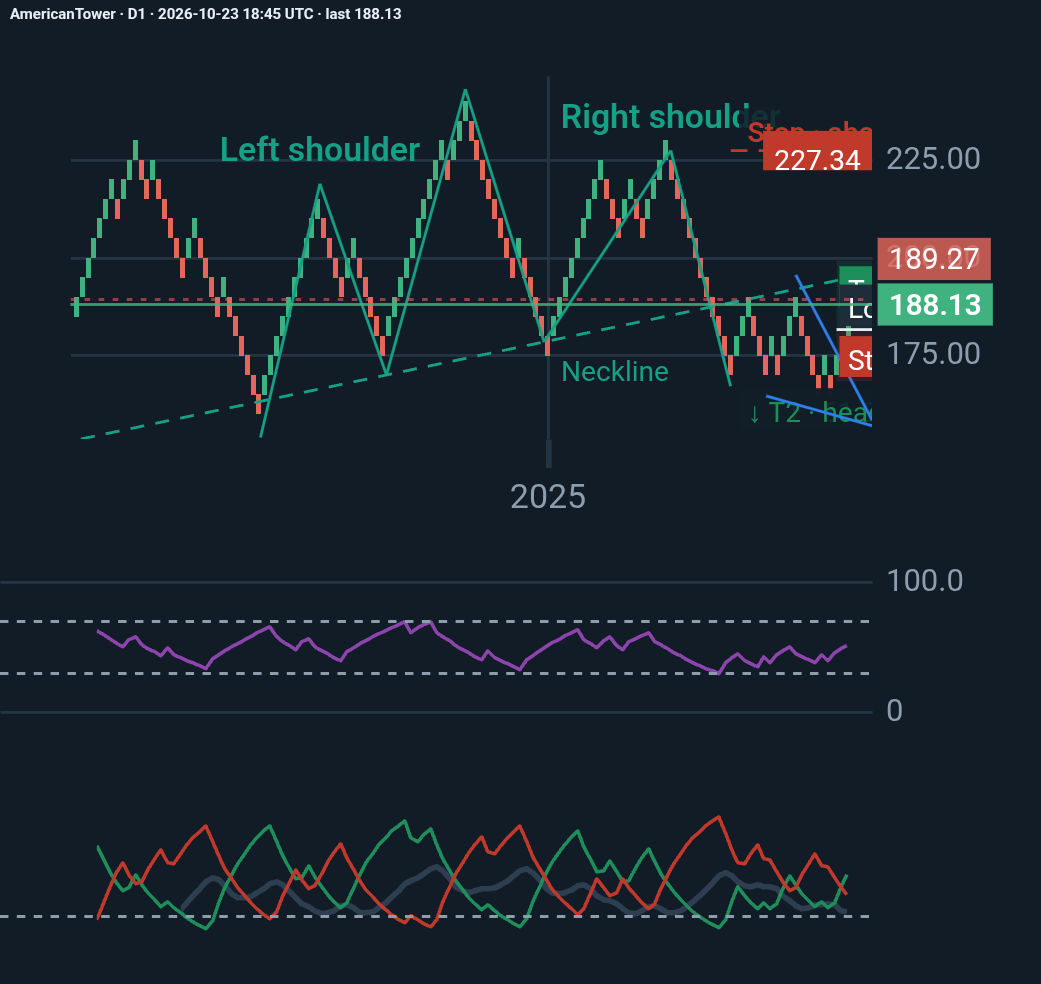
AmericanTower D1 analysis
American Tower (AMT): A recovery within a potentially bearish structure. American Tower is showing improving short-term momentum, but the broader technical picture remains uncerta…
Reza E. 3 days, 13 hours ago ♥ 0 💬 0
Price since published: -0.21%
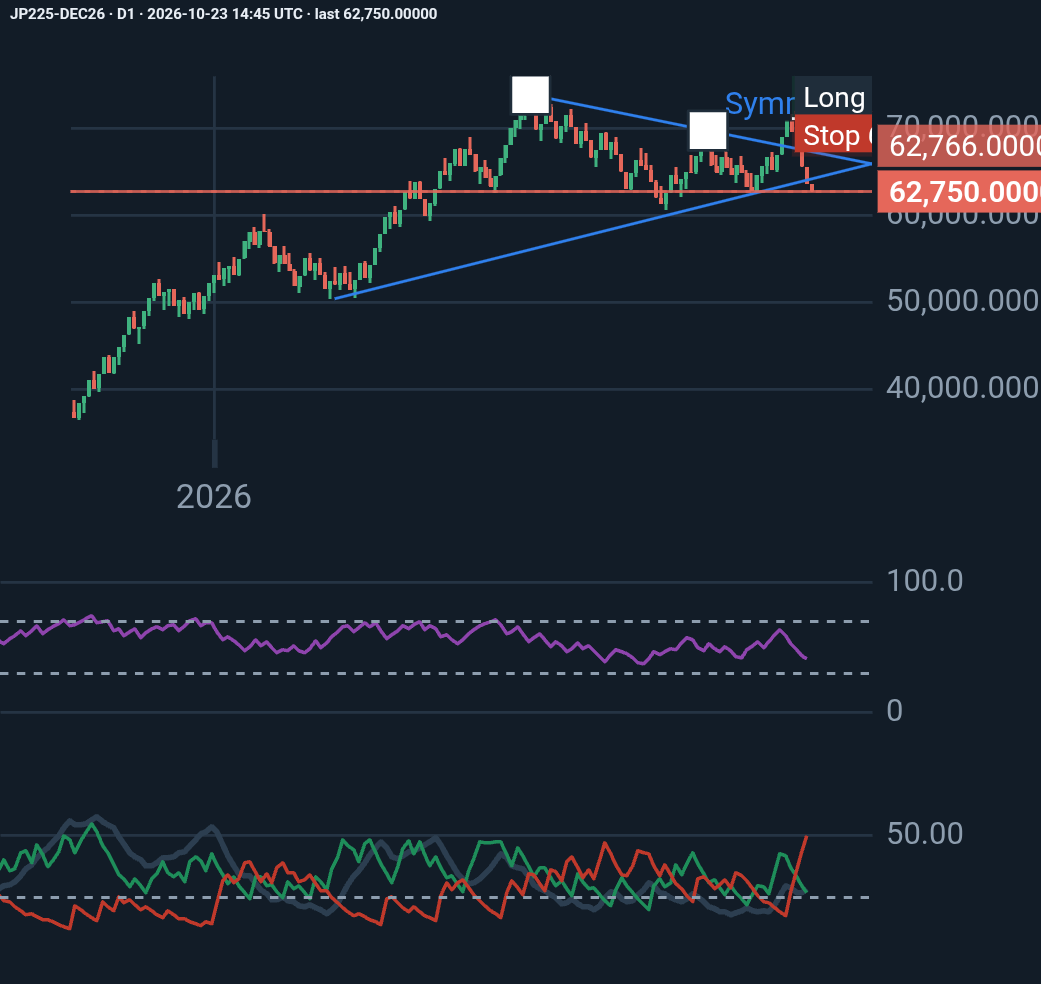
JP225-DEC26 D1 analysis
JP225-DEC26 Technical Outlook 📊 The Nikkei 225 futures chart shows increasing bearish pressure, with RSI at 41.82 and −DI significantly above +DI. Price is approaching a key suppo…
Reza E. 3 days, 17 hours ago ♥ 0 💬 0
Price since published: +1.28% · against the idea
Ideas are the author's opinion, not investment advice. Past moves do not predict future ones.
Comments 0
Sign in or create a free account to like, follow and comment.