
AmericanTower D1 analysis
 Open on the live chart ↗
Price when published: 188.080000 · now 187.680000 (-0.21%)
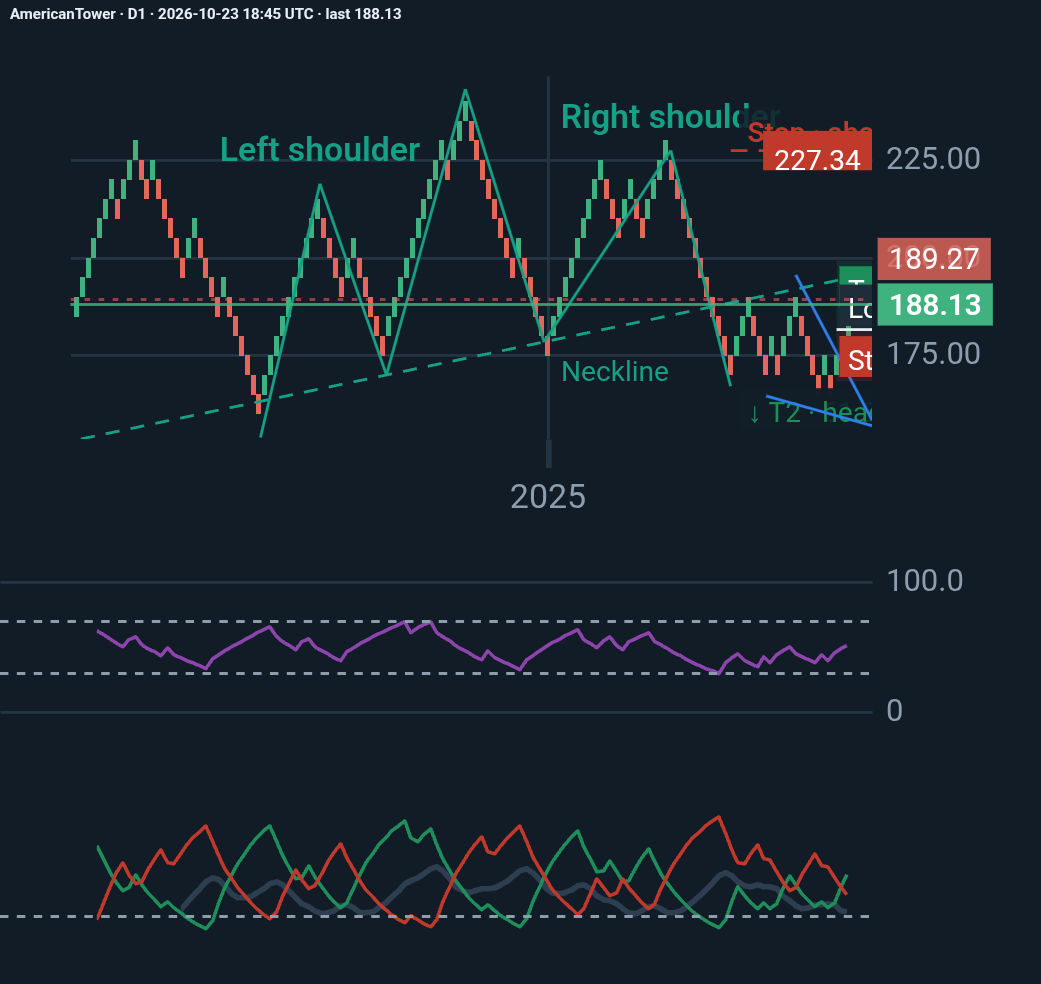
American Tower (AMT): A recovery within a potentially bearish structure.
American Tower is showing improving short-term momentum, but the broader technical picture remains uncertain.
On the daily chart, RSI stands near 64, while ADX at 34.10 and +DI at 49.56 versus -DI at 14.49 indicate strong bullish directional momentum.
However, price has not clearly reclaimed the neckline of the previously identified head-and-shoulders pattern. Improving momentum does not automatically invalidate a larger bearish structure.
Key levels to watch: • $188–190: Near-term resistance • $195.52: Major range resistance • $178–180: Support zone • $168–170: Critical structural support
A sustained breakout above resistance would strengthen the recovery scenario. Conversely, renewed selling below support could reopen downside risks.
My takeaway: AMT is recovering, but confirmation is still needed. Price action around key levels matters more than relying on indicators in isolation.
#AmericanTower #TechnicalAnalysis #StockMarket #Trading #Investing
More from Reza E.
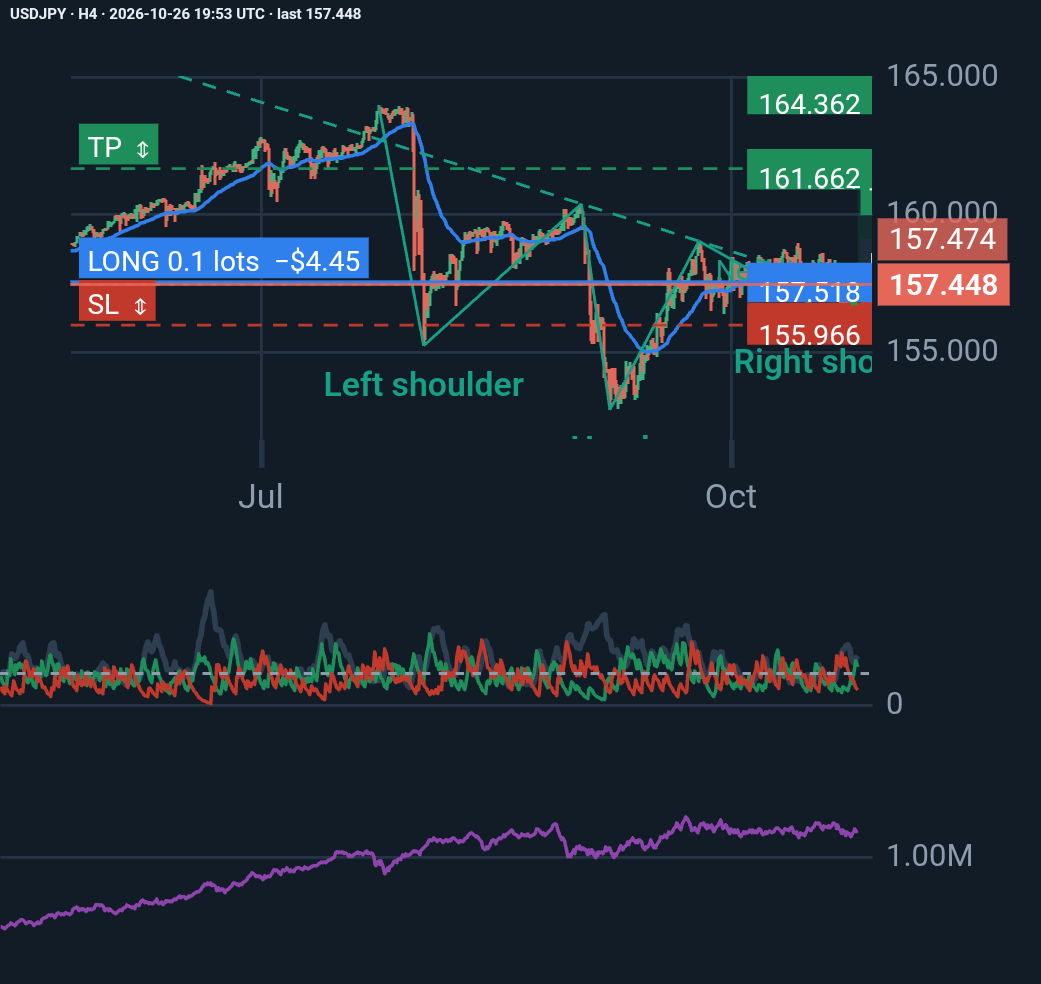
USD/JPY H4 Analysis: A Bullish Reversal or Just a Temporary Recovery?
USD/JPY is showing signs of short-term bullish momentum, but the bigger picture still calls for caution. Here are the key observations from my latest technical analysis: 📈 1. Inv…
Reza E. 12 hours, 17 minutes ago ♥ 0 💬 0
Price since published: +0.26% · in the idea's favour
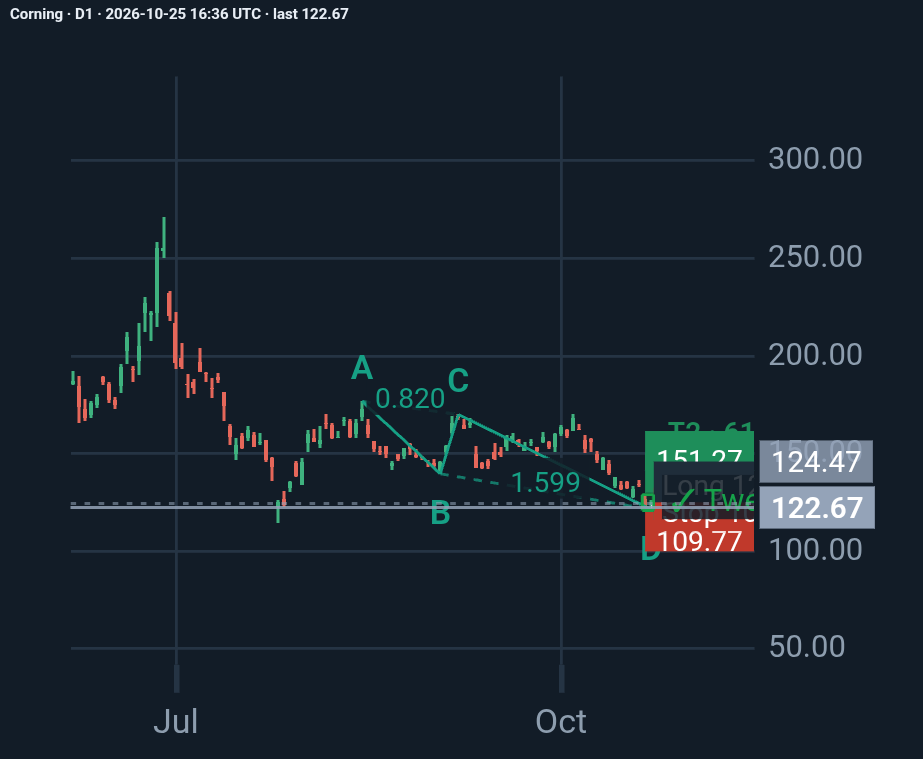
Corning D1 analysis
Corning Inc. (GLW) | Daily Chart Analysis: A Potential Bullish Reversal? Corning is approaching an important technical decision point, with a potential bullish AB=CD harmonic patt…
Reza E. 1 day, 15 hours ago ♥ 0 💬 0
Price since published: +3.45% · in the idea's favour
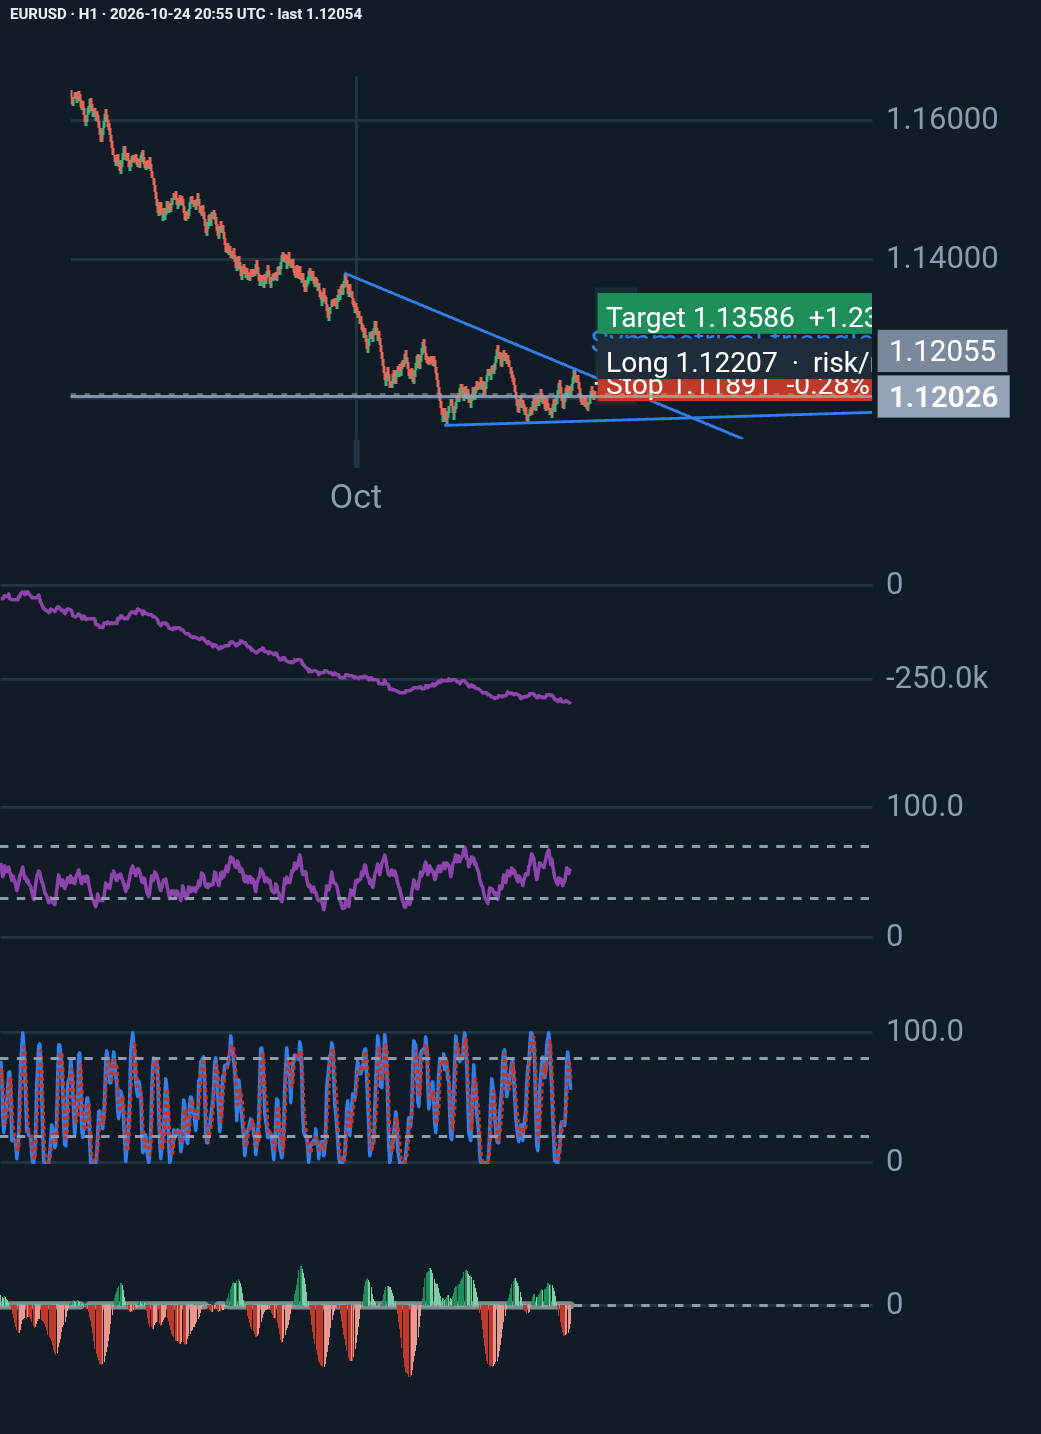
EUR/USD H1: A Promising Triangle Setup, but Is the Breakout Worth Trading?
Technical analysis is not just about spotting patterns. It is about understanding the conditions behind them, defining risk, and knowing when a trade thesis is no longer valid. Wh…
Reza E. 2 days, 11 hours ago ♥ 0 💬 0
Price since published: -0.42% · against the idea
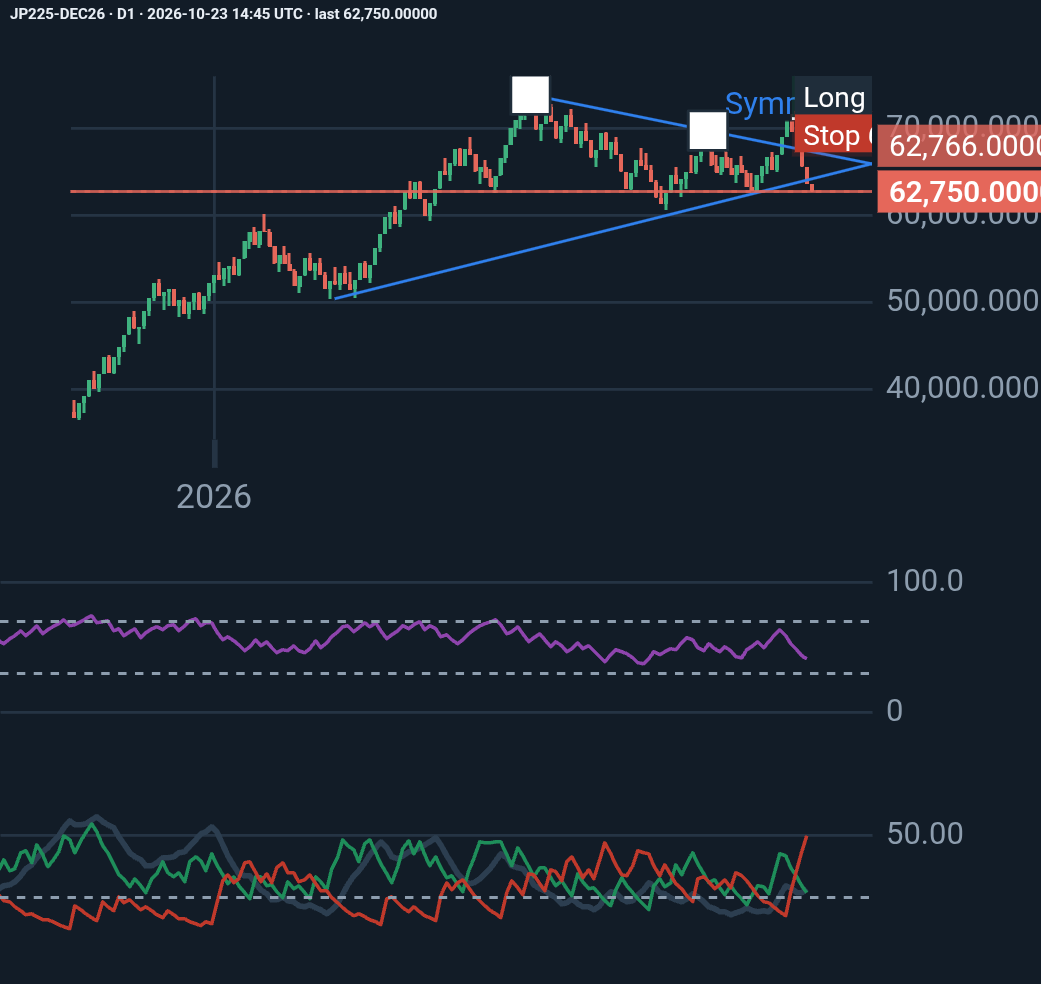
JP225-DEC26 D1 analysis
JP225-DEC26 Technical Outlook 📊 The Nikkei 225 futures chart shows increasing bearish pressure, with RSI at 41.82 and −DI significantly above +DI. Price is approaching a key suppo…
Reza E. 3 days, 17 hours ago ♥ 0 💬 0
Price since published: +1.29% · against the idea
Ideas are the author's opinion, not investment advice. Past moves do not predict future ones.
Comments 0
Sign in or create a free account to like, follow and comment.