आइडिया

ट्रेडिंग आइडिया

ट्रेडर्स के प्रकाशित चार्ट विश्लेषण: वे क्या देखते हैं, कहाँ एंट्री लेंगे, उनके लक्ष्य और स्टॉप। कोई भी आइडिया लाइव चार्ट पर खोलें, उसकी स्ट्रैटेजी टेस्ट करें, जिनके आइडिया पसंद हों उन्हें फ़ॉलो करें।

मुफ़्त खाता बनाएँ

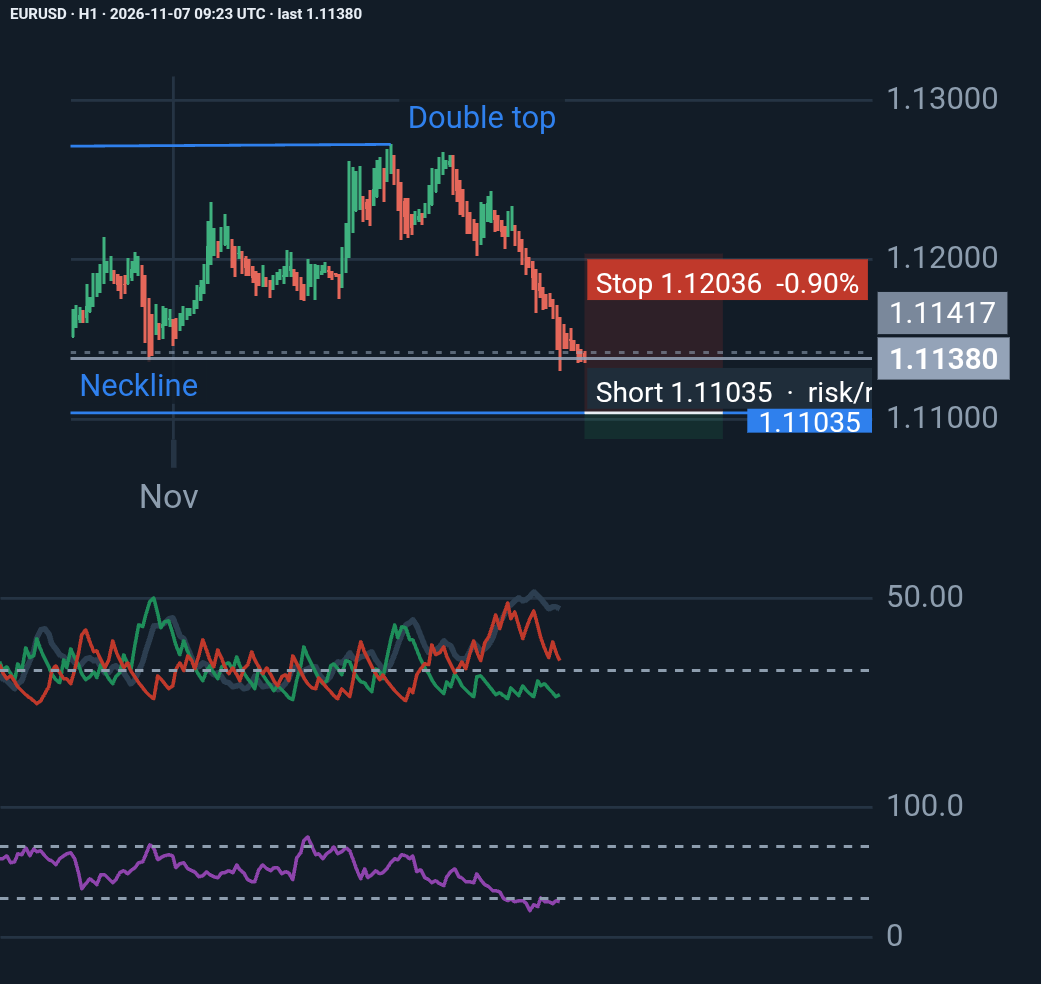
EURUSD · H1 Long

EURUSD H1: Bears Remain in Control, but Is a Reversal Approaching?

EURUSD remains under strong bearish pressure, with ADX at 45.88 and -DI (24.08) significantly above +DI (10.21). RSI at 27.06 signals oversold conditions, raising the possibility …

Trader 1 day, 13 hours पहले ♥ 0 💬 0

प्रकाशन के बाद से कीमत: -0.02% · आइडिया के विरुद्ध
Solv Energy · D1 Long

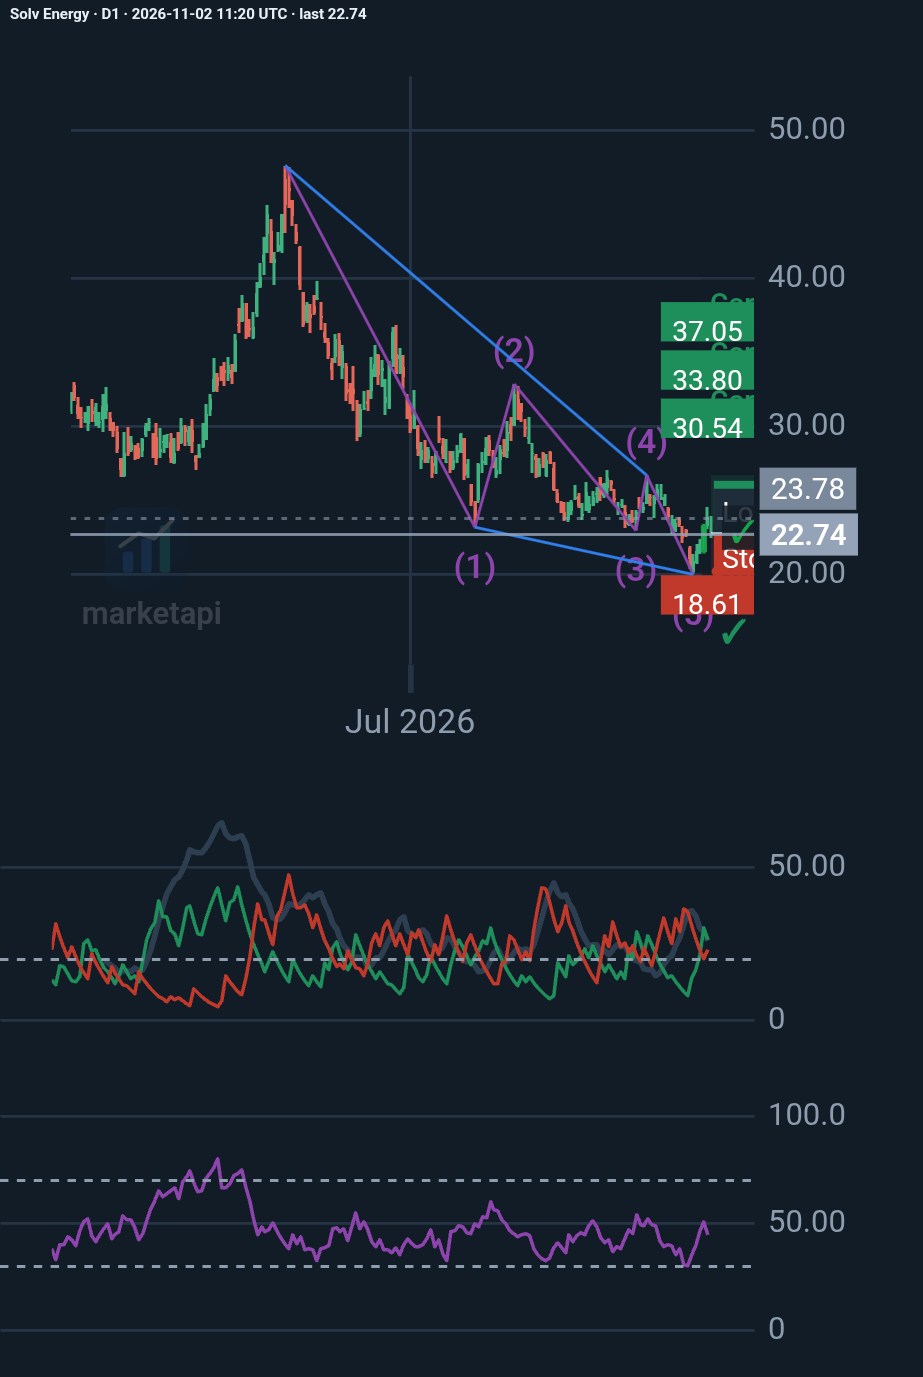
SOLV Energy (NASDAQ: MWH): A bullish reversal on the horizon?

My D1 analysis identifies a potential Elliott Wave ending diagonal, suggesting the prolonged decline may be approaching exhaustion. Key levels: • $19.99 – Critical support • $23.9…

Trader 6 days, 11 hours पहले ♥ 0 💬 0

प्रकाशन के बाद से कीमत: +10.73% · आइडिया के पक्ष में

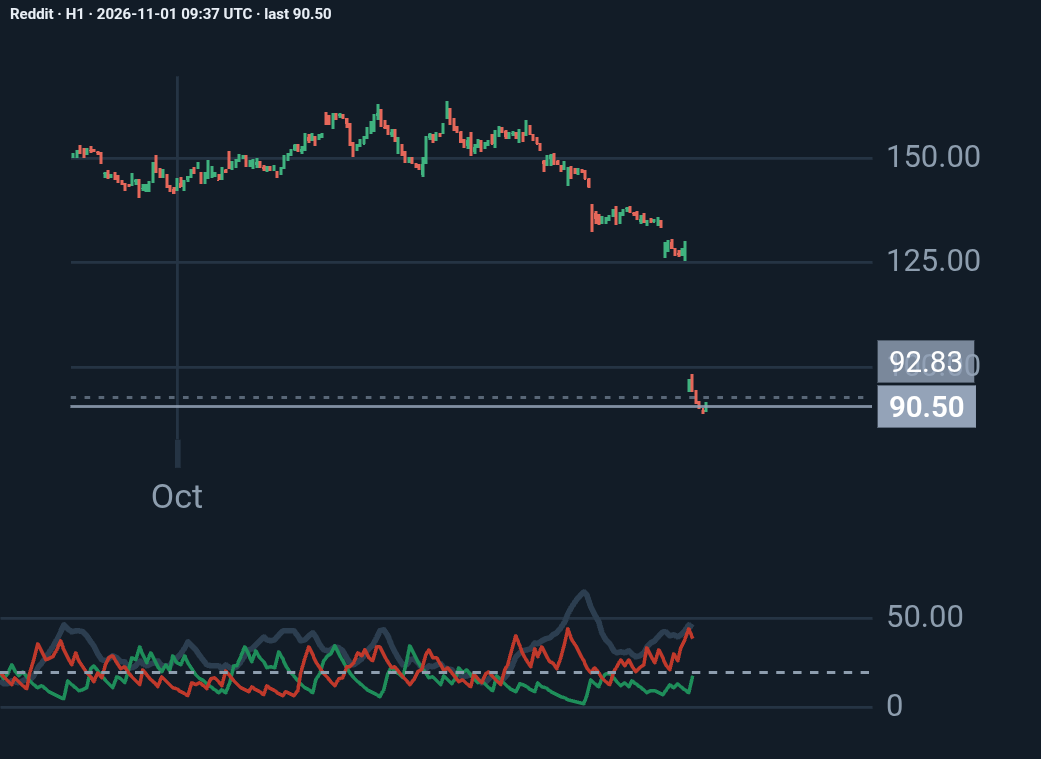
Reddit · H1 Neutral

Reddit H1: my analysis

Reddit lost about 30% of its market value on October 30, 2026, the day after its third-quarter earnings, because it admitted that traffic arriving from Google search has dropped si…

Trader 1 week पहले ♥ 0 💬 0

प्रकाशन के बाद से कीमत: +3.69%

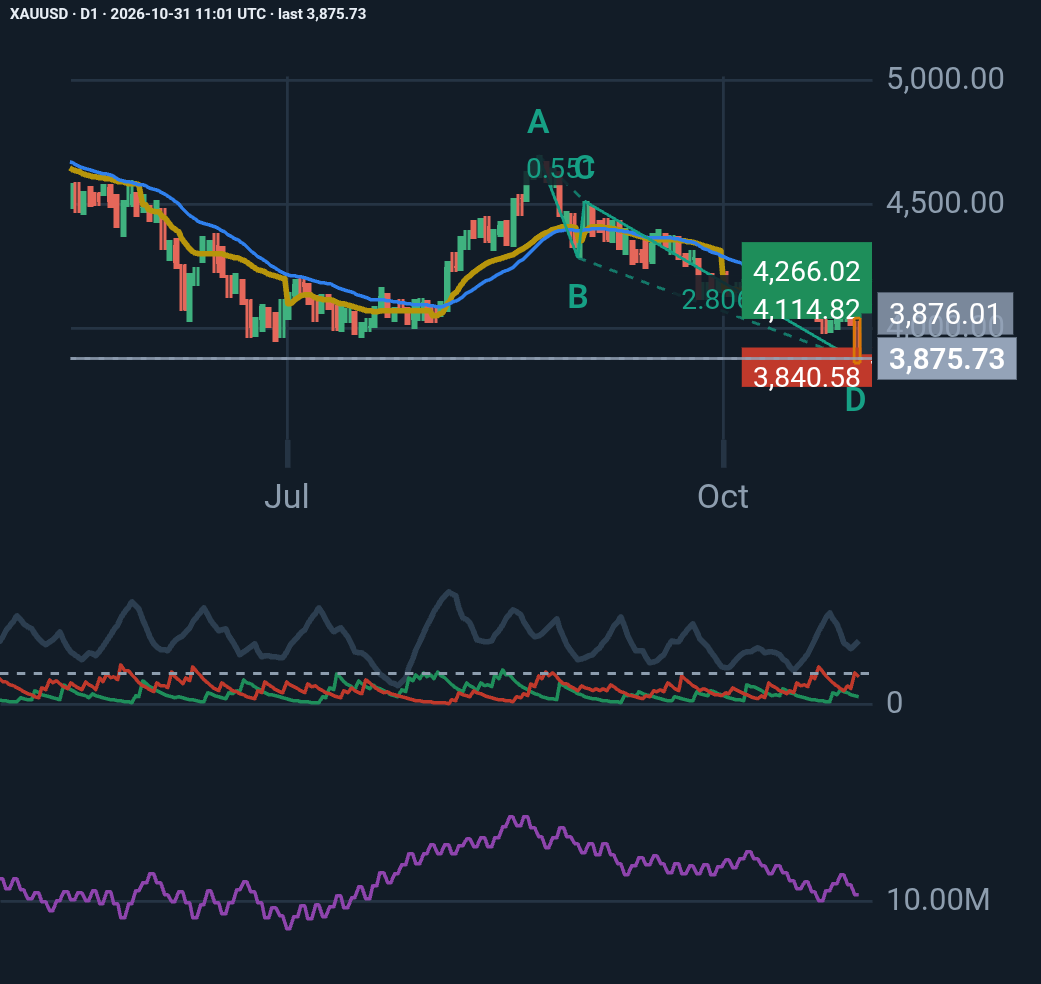
XAUUSD · D1 Long

Gold (XAUUSD) – Daily Technical Analysis | October 31, 2026

Gold is showing significant bearish momentum after a sharp decline, but an interesting bullish AB=CD harmonic pattern has emerged near the recent low of $3,870. Here are the key o…

Trader 1 week, 1 day पहले ♥ 0 💬 0

प्रकाशन के बाद से कीमत: +5.04% · आइडिया के पक्ष में

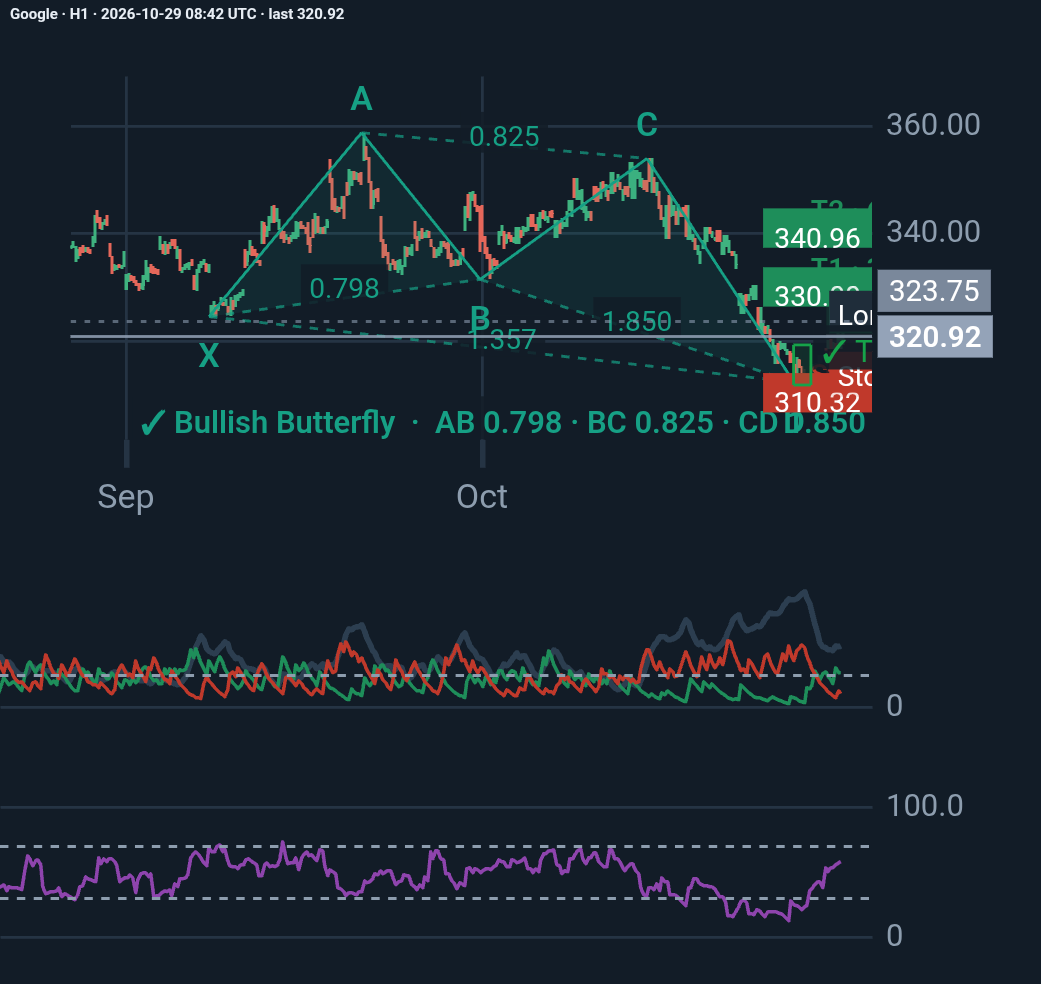
Google · H1 Long

Google (GOOGL) – Daily Technical Analysis | 29 October 2026

Google (GOOGL) – D1 Technical Analysis 📊 A potential bullish Butterfly pattern is forming near the $312–$319 support zone, supported by a possible Tweezer Bottom. 🎯 Upside target…

Trader 1 week, 3 days पहले ♥ 0 💬 0

प्रकाशन के बाद से कीमत: -11.99% · आइडिया के विरुद्ध
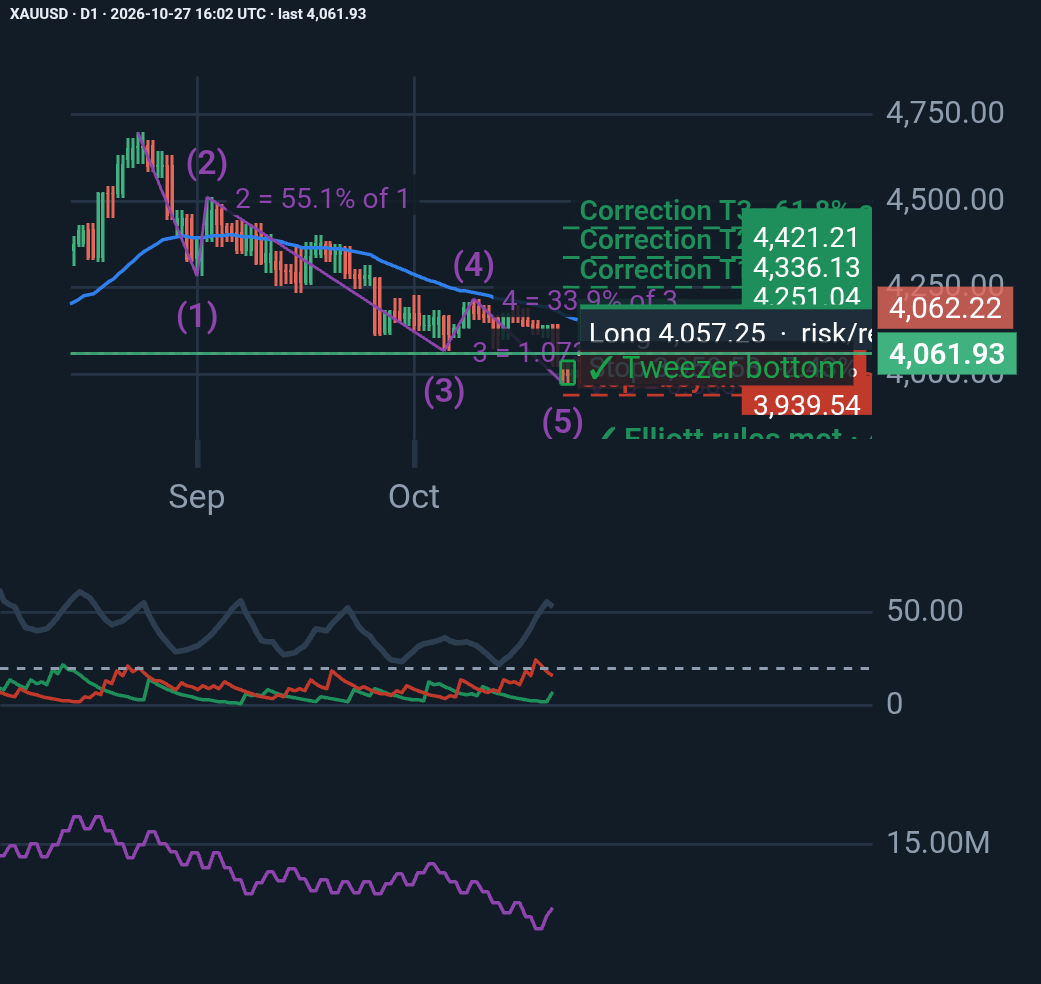
XAUUSD · D1 Long

XAUUSD D1 analysis

Gold (XAUUSD) | Daily Technical Analysis | October 26, 2026 Is gold preparing for a corrective rebound after a strong bearish move? On the daily chart, XAUUSD has declined from 4…

Trader 1 week, 5 days पहले ♥ 0 💬 0

प्रकाशन के बाद से कीमत: +0.22% · आइडिया के पक्ष में

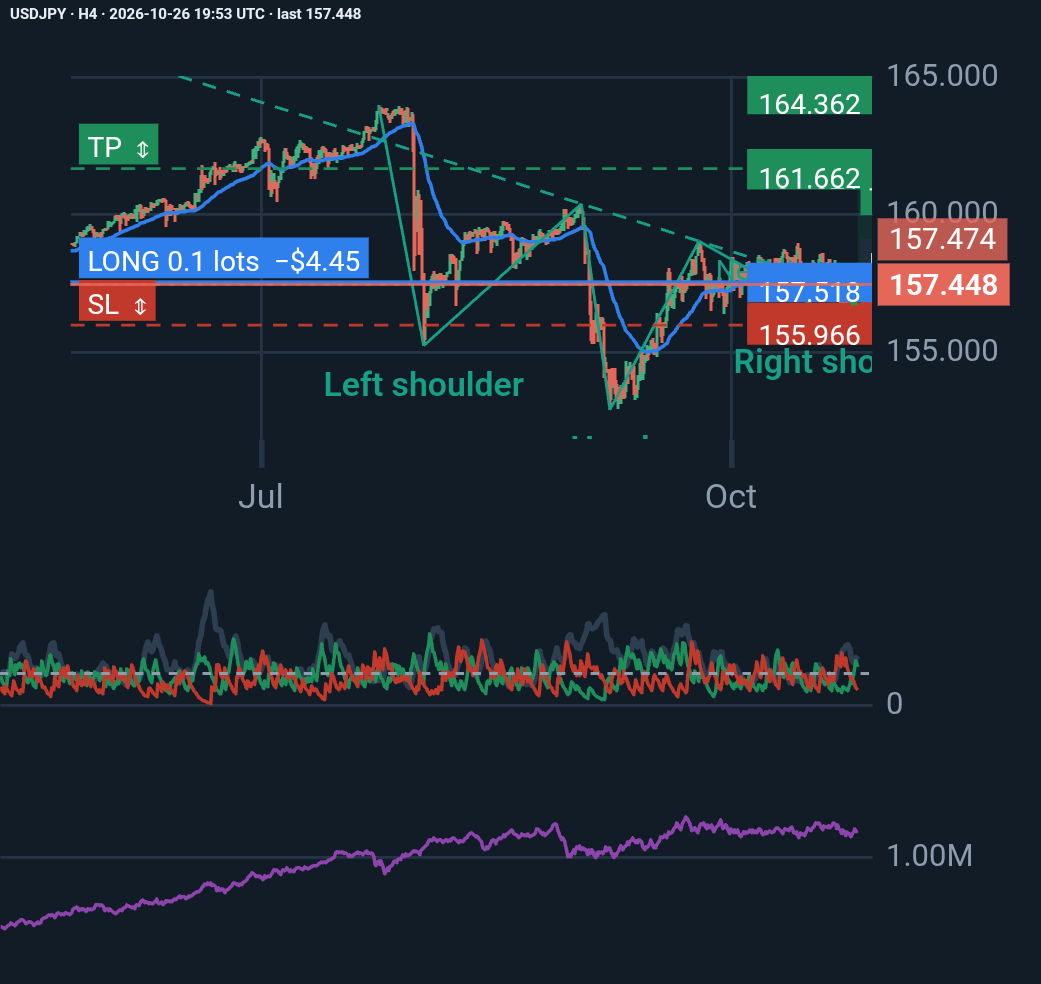
USDJPY · H4 Long

USD/JPY H4 Analysis: A Bullish Reversal or Just a Temporary Recovery?

USD/JPY is showing signs of short-term bullish momentum, but the bigger picture still calls for caution. Here are the key observations from my latest technical analysis: 📈 1. Inv…

Trader 1 week, 6 days पहले ♥ 0 💬 0

प्रकाशन के बाद से कीमत: +0.58% · आइडिया के पक्ष में

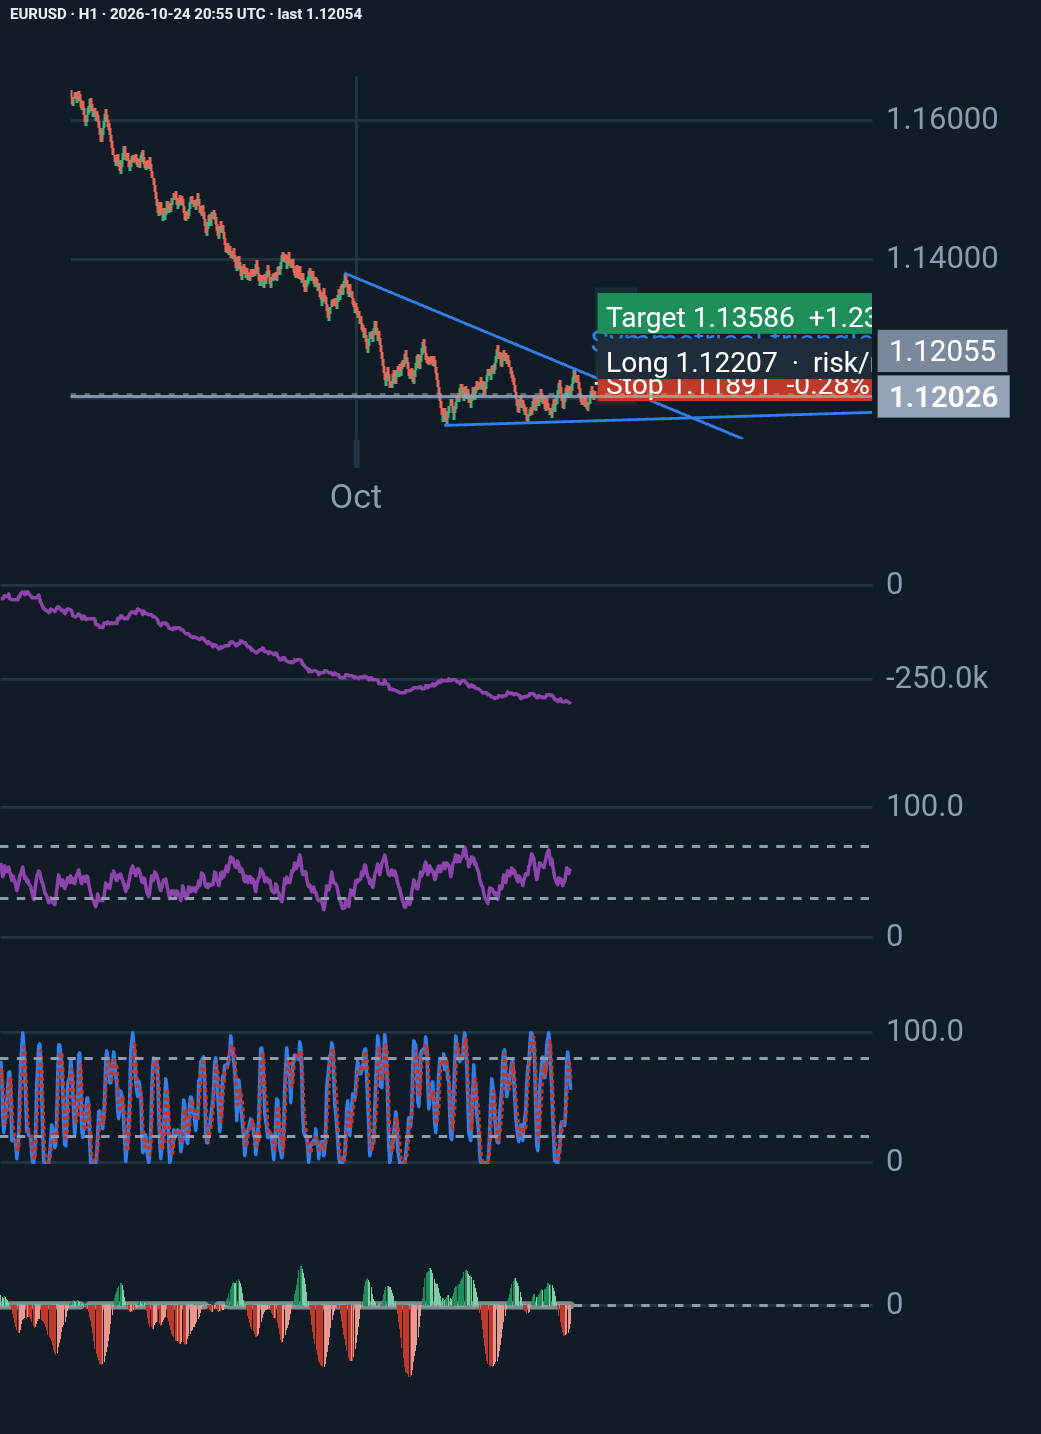
EURUSD · H1 Long

EUR/USD H1: A Promising Triangle Setup, but Is the Breakout Worth Trading?

Technical analysis is not just about spotting patterns. It is about understanding the conditions behind them, defining risk, and knowing when a trade thesis is no longer valid. Wh…

Trader 2 weeks, 1 day पहले ♥ 0 💬 0

प्रकाशन के बाद से कीमत: -0.60% · आइडिया के विरुद्ध
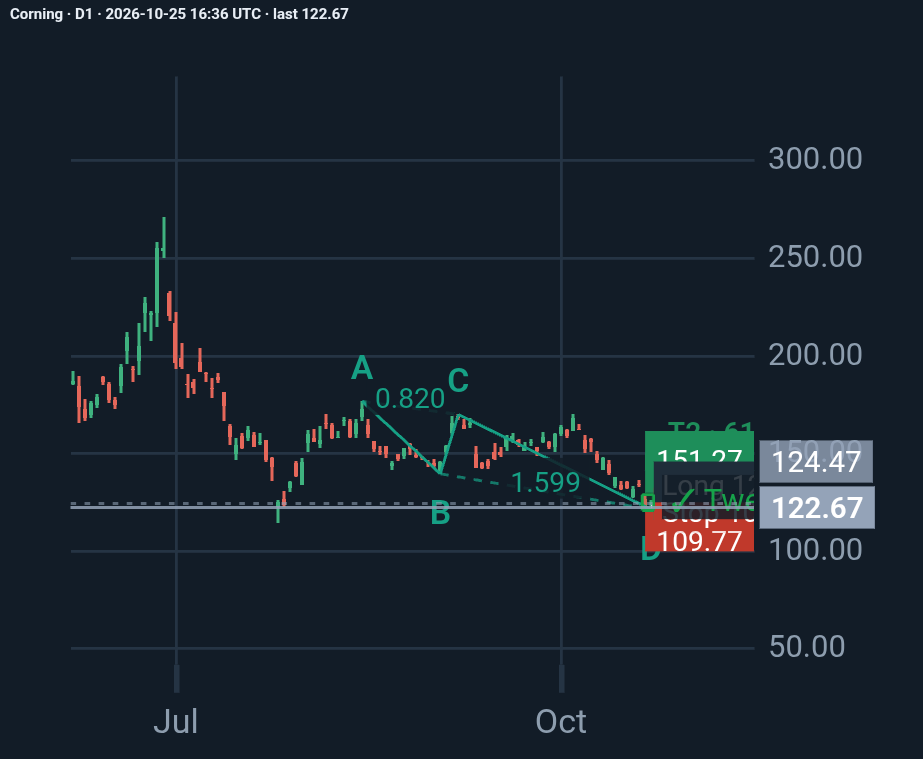
Corning · D1 Long

Corning D1 analysis

Corning Inc. (GLW) | Daily Chart Analysis: A Potential Bullish Reversal? Corning is approaching an important technical decision point, with a potential bullish AB=CD harmonic patt…

Trader 2 weeks पहले ♥ 0 💬 0

प्रकाशन के बाद से कीमत: -14.19% · आइडिया के विरुद्ध

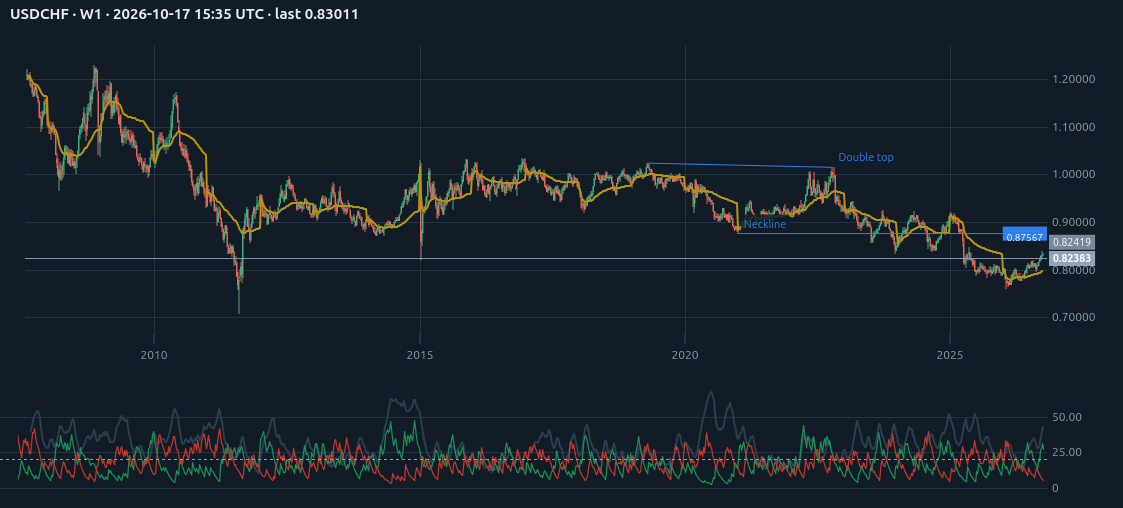
USDCHF · W1 Neutral

USDCHF W1 analysis

US Dollar vs Swiss Franc

Trader 3 weeks, 1 day पहले ♥ 0 💬 1

प्रकाशन के बाद से कीमत: -0.60%

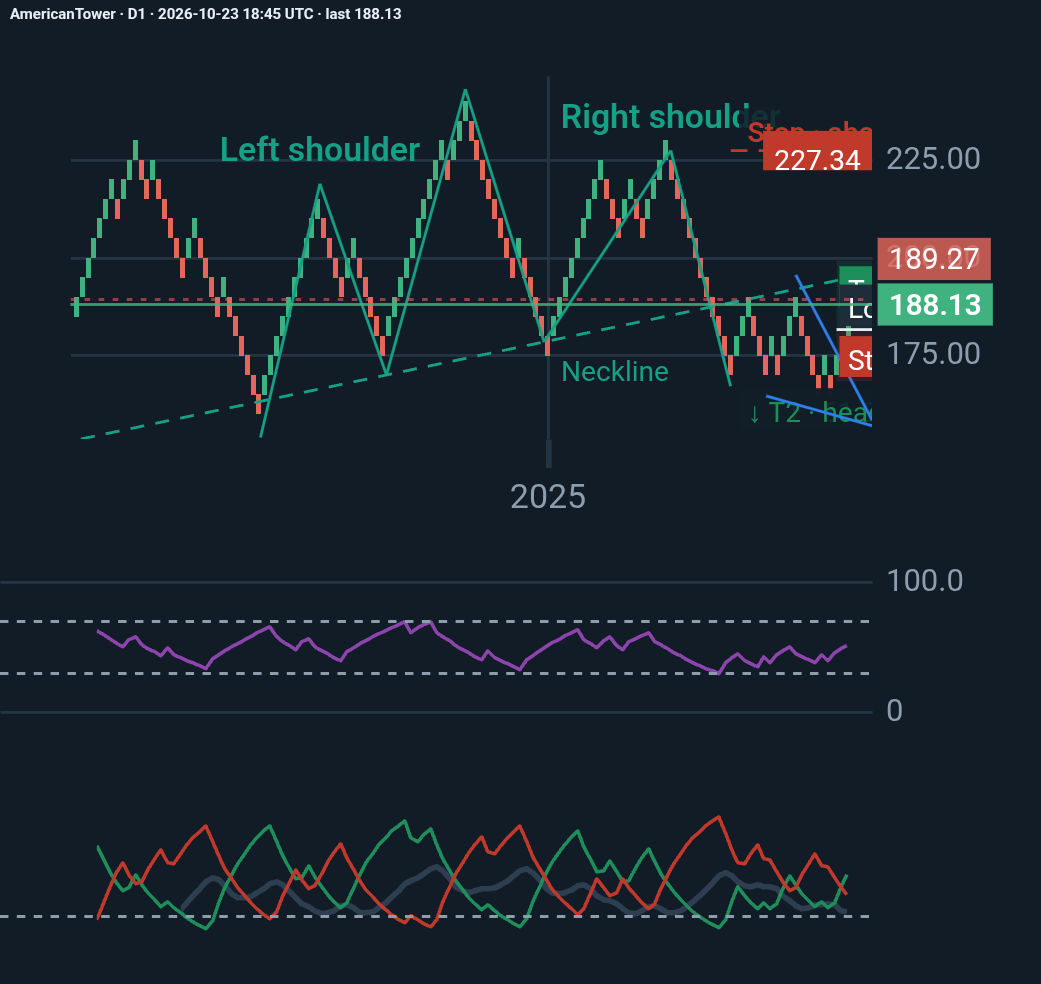
AmericanTower · D1 Neutral

AmericanTower D1 analysis

American Tower (AMT): A recovery within a potentially bearish structure. American Tower is showing improving short-term momentum, but the broader technical picture remains uncerta…

Trader 2 weeks, 2 days पहले ♥ 0 💬 0

प्रकाशन के बाद से कीमत: +0.03%

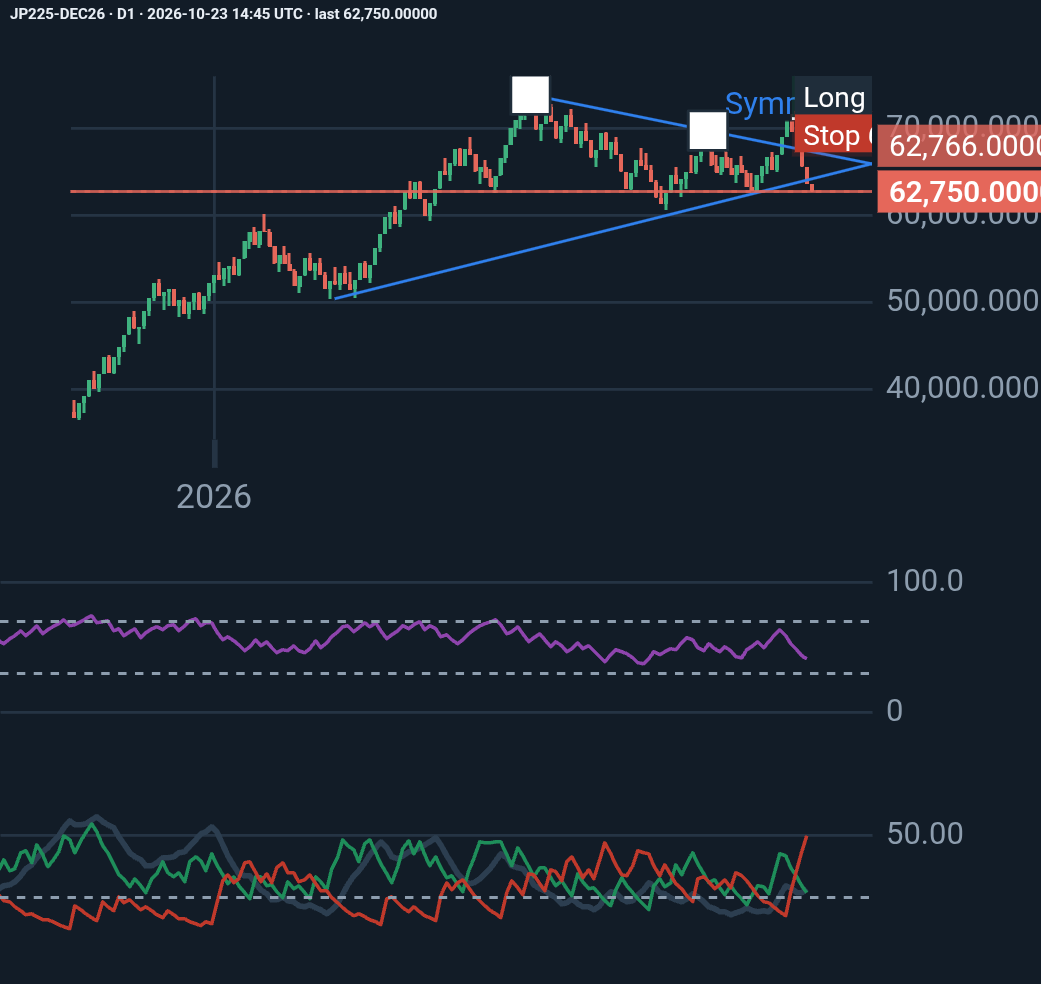
JP225-DEC26 · D1 Short

JP225-DEC26 D1 analysis

JP225-DEC26 Technical Outlook 📊 The Nikkei 225 futures chart shows increasing bearish pressure, with RSI at 41.82 and −DI significantly above +DI. Price is approaching a key suppo…

Trader 2 weeks, 2 days पहले ♥ 0 💬 0

प्रकाशन के बाद से कीमत: -7.19% · आइडिया के पक्ष में

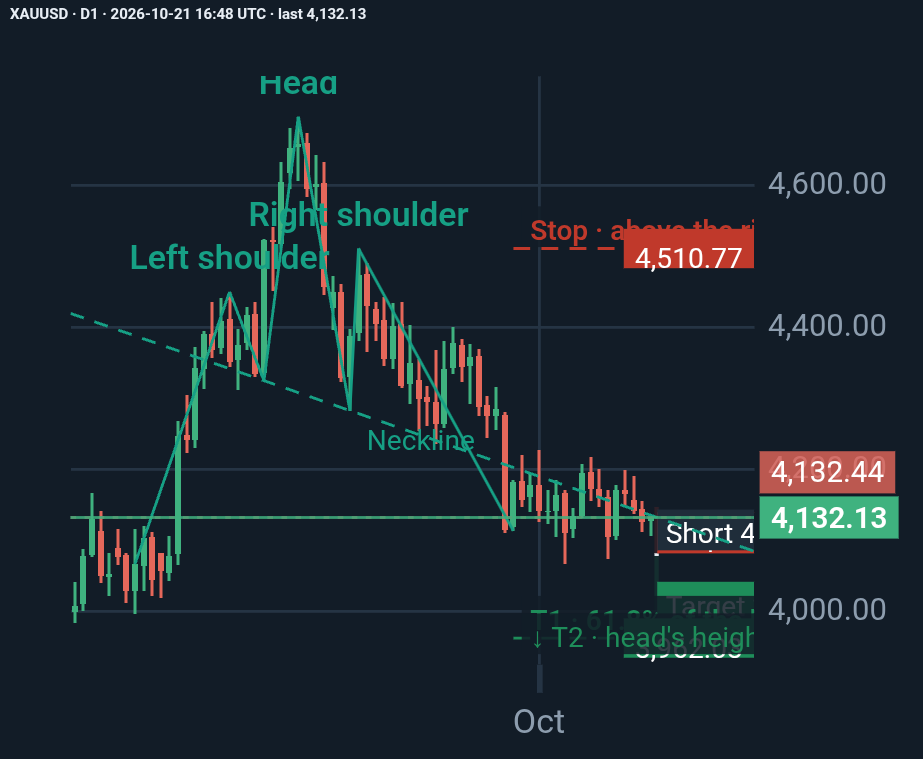
XAUUSD · D1 Short

XAUUSD HEAD AND SHOULDERS

The short (entry 4,079.66, stop 4,146.69, target 3,977.89) is the more actionable idea. Entry sits below the 4,105–4,115 decision zone; target aligns with the next demand shelf; st…

Trader 2 weeks, 4 days पहले ♥ 0 💬 0

प्रकाशन के बाद से कीमत: -1.48% · आइडिया के पक्ष में

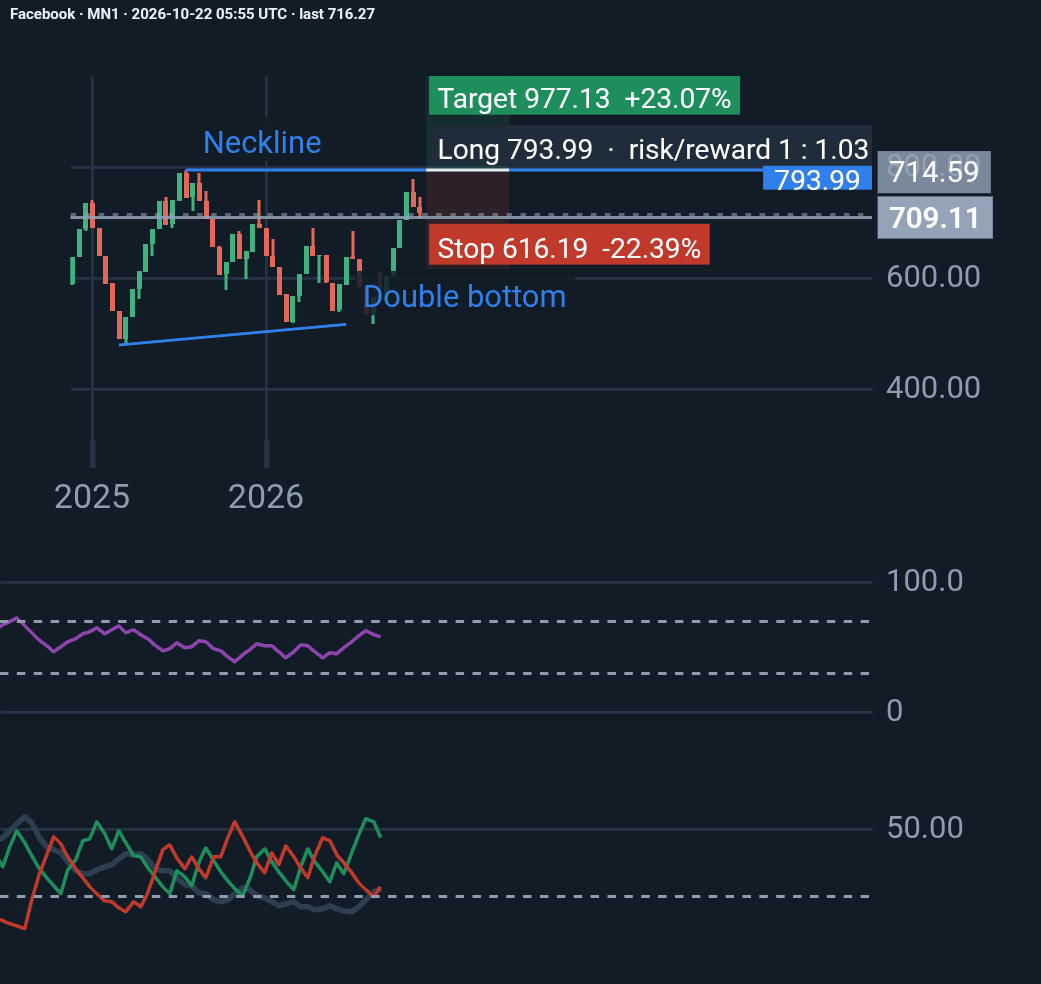
Facebook · MN1 Long

Facebook MN1 analysis

Entry on a close through the middle high; stop 60% back into the pattern (the cautious stop is beyond the lows, 454.62).

Trader 2 weeks, 3 days पहले ♥ 0 💬 0

प्रकाशन के बाद से कीमत: -14.41% · आइडिया के विरुद्ध

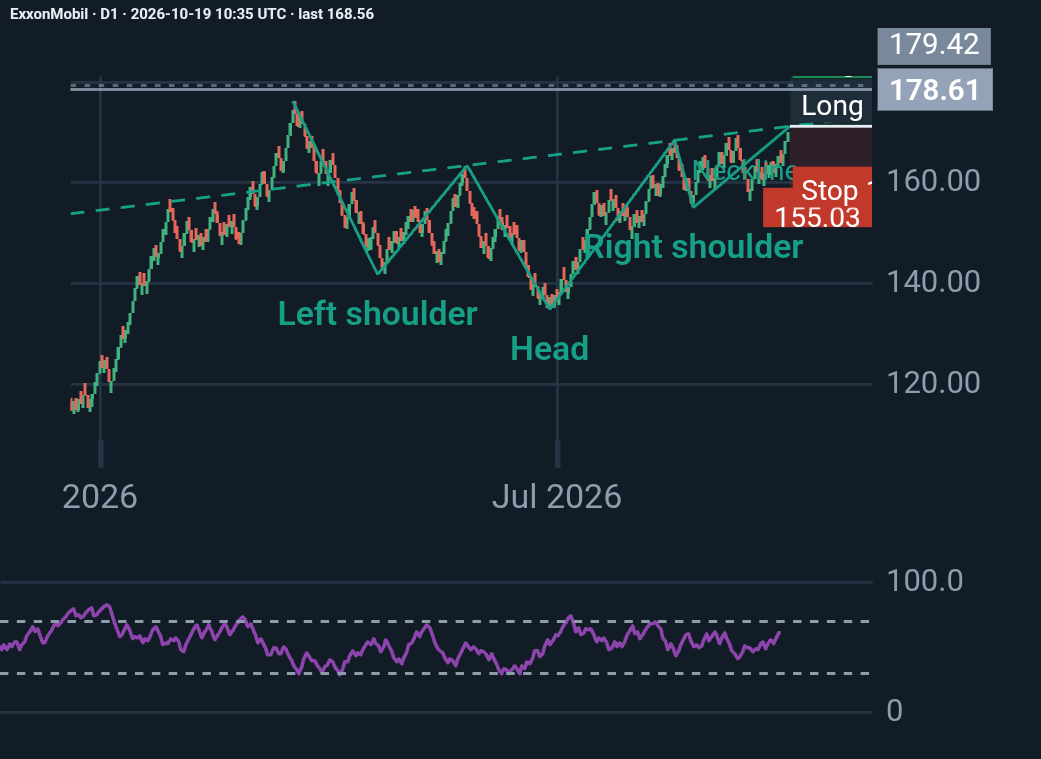
ExxonMobil · D1 Long

ExxonMobil (XOM) shows bullish potential toward $190–$202, with momentum favouring buyers, but breakout confirmation and

📊 ExxonMobil (XOM) | Daily Technical Analysis ExxonMobil is showing a potentially bullish technical setup, with an inverse Head and Shoulders pattern suggesting further upside if …

Trader 2 weeks, 6 days पहले ♥ 0 💬 0

प्रकाशन के बाद से कीमत: -7.39% · आइडिया के विरुद्ध

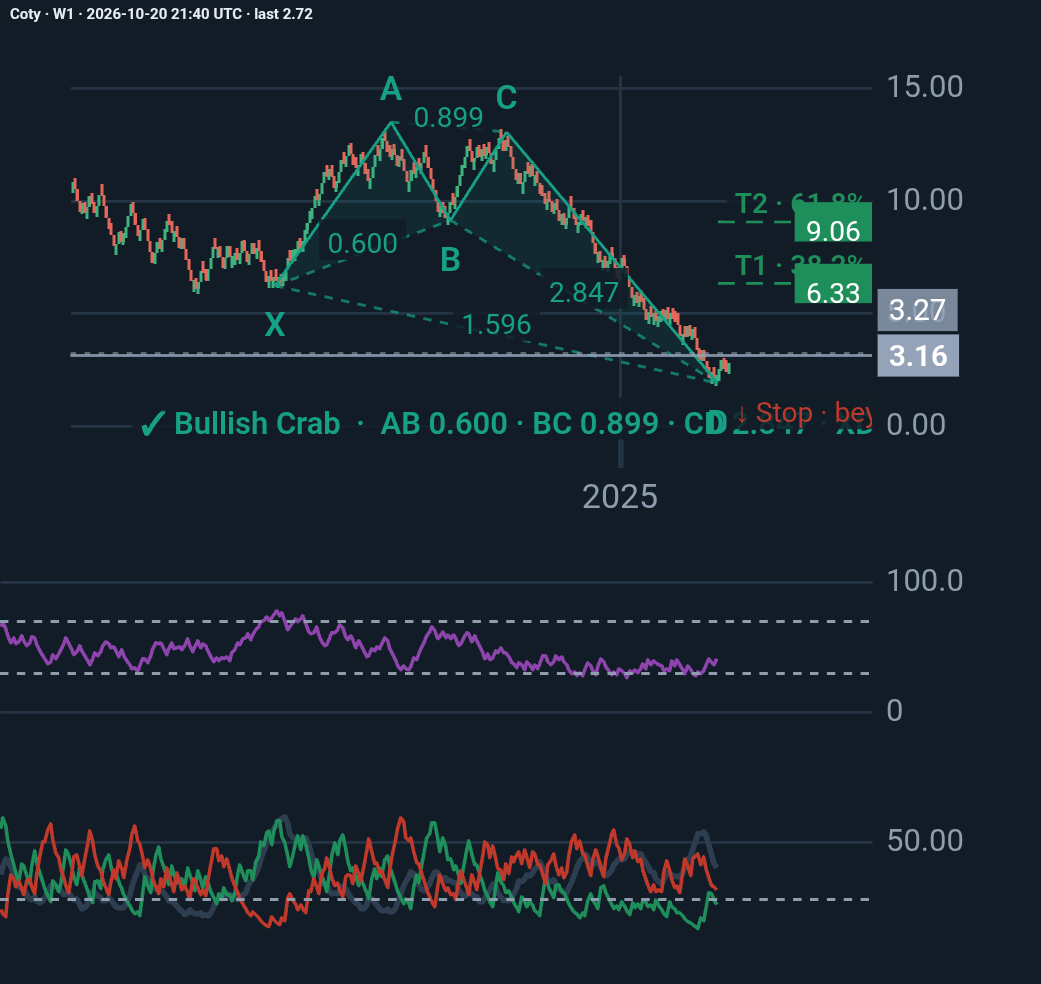
Coty · W1 Long

Coty W1 analysis

Coty’s weekly chart suggests a potential bullish recovery from the Crab harmonic completion near $1.91, with targets at $6.33 and $9.06. However, RSI at 41.19 and −DI above +DI ind…

Trader 2 weeks, 5 days पहले ♥ 0 💬 0

प्रकाशन के बाद से कीमत: +25.00% · आइडिया के पक्ष में

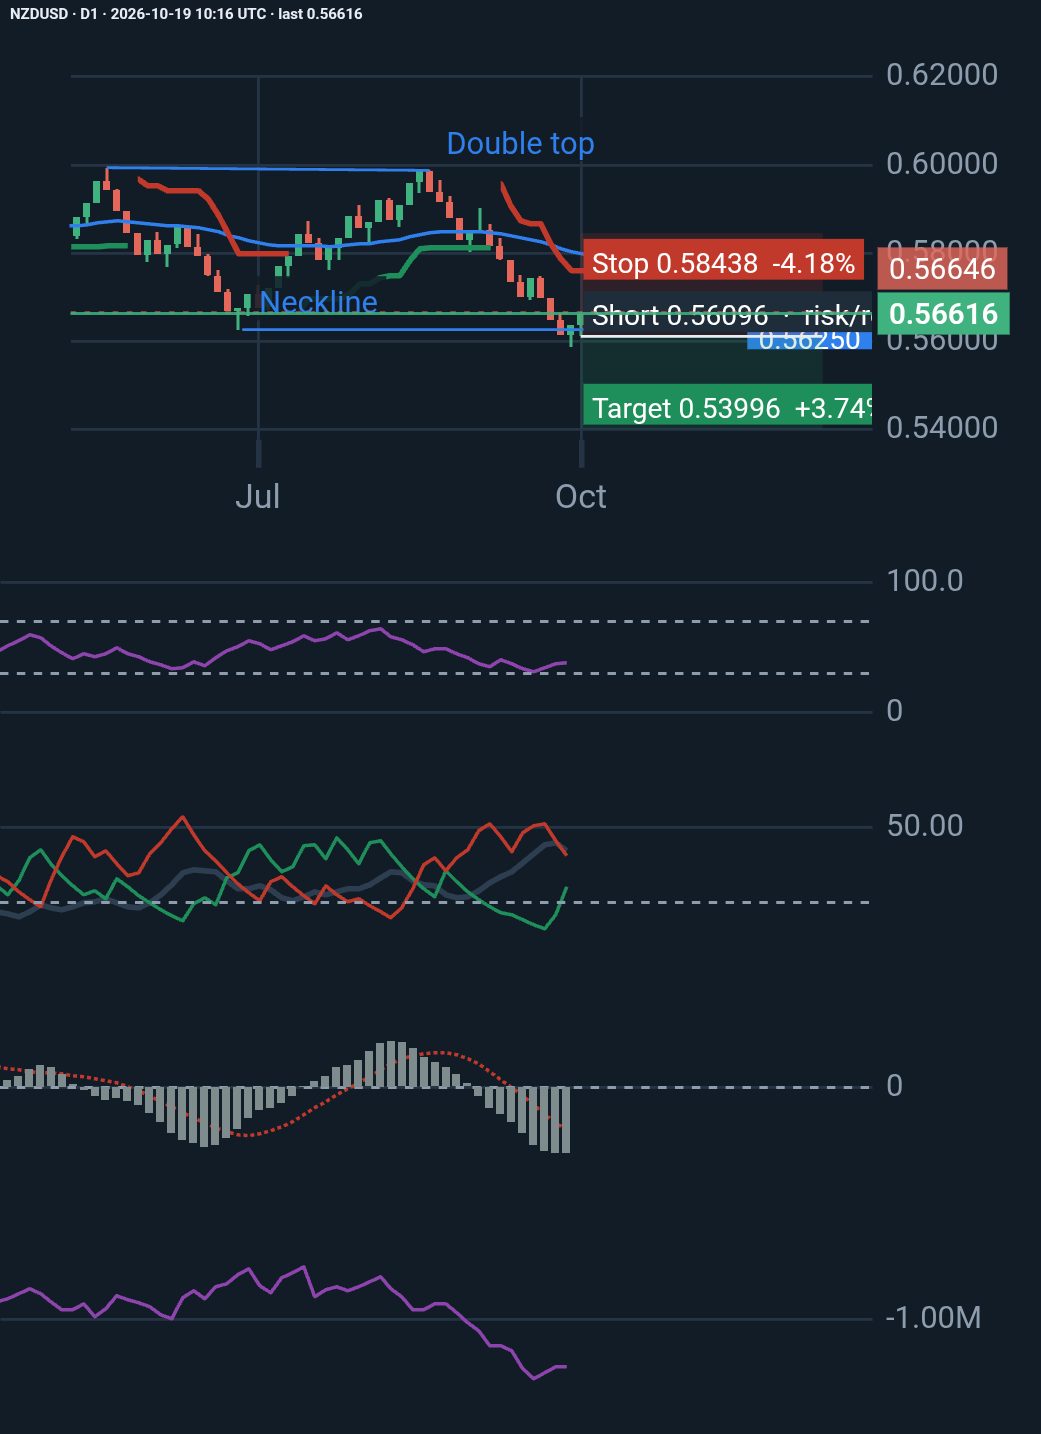
NZDUSD · D1 Long

NZDUSD D1 analysis

📉 NZDUSD Technical Analysis | Daily Chart NZDUSD maintains a bearish bias, trading at 0.56615 below the 50-day EMA (0.5771) and SuperTrend (0.5745). 🔎 Key observations: - RSI (3…

Trader 2 weeks, 6 days पहले ♥ 0 💬 0

प्रकाशन के बाद से कीमत: -1.85% · आइडिया के विरुद्ध

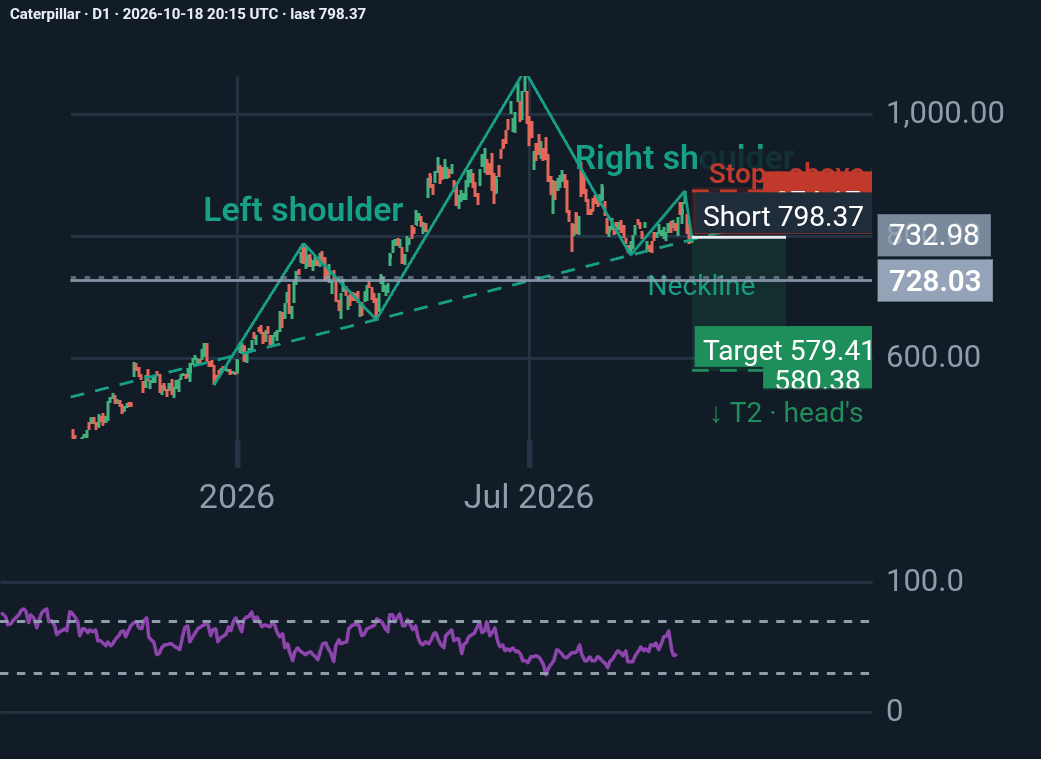
Caterpillar · D1 Short

CAT

Caterpillar’s chart suggests a bearish reversal, with the head-and-shoulders pattern indicating potential downside toward 580 or even 448. However, price at 798.37 is above the sta…

Trader 3 weeks पहले ♥ 0 💬 0

प्रकाशन के बाद से कीमत: -23.63% · आइडिया के पक्ष में

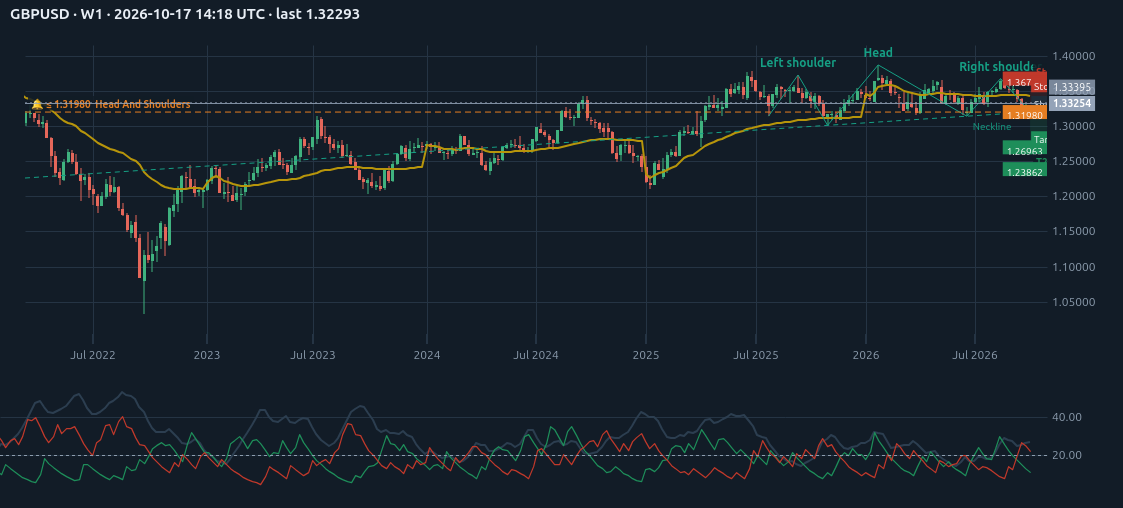
GBPUSD · W1 Short

GBPUSD W1 analysis

Watch the neckline at 1.31981 · small swings ▼ Short 1.31981 · stop order (on the breakout) Stop 1.37144 (3.91%)T1 1.26963 · R:R 1:0.97T2 1.23862 · R:R 1:1.57 Entry on a close thro…

Trader 3 weeks, 1 day पहले ♥ 0 💬 0

प्रकाशन के बाद से कीमत: +0.17% · आइडिया के विरुद्ध

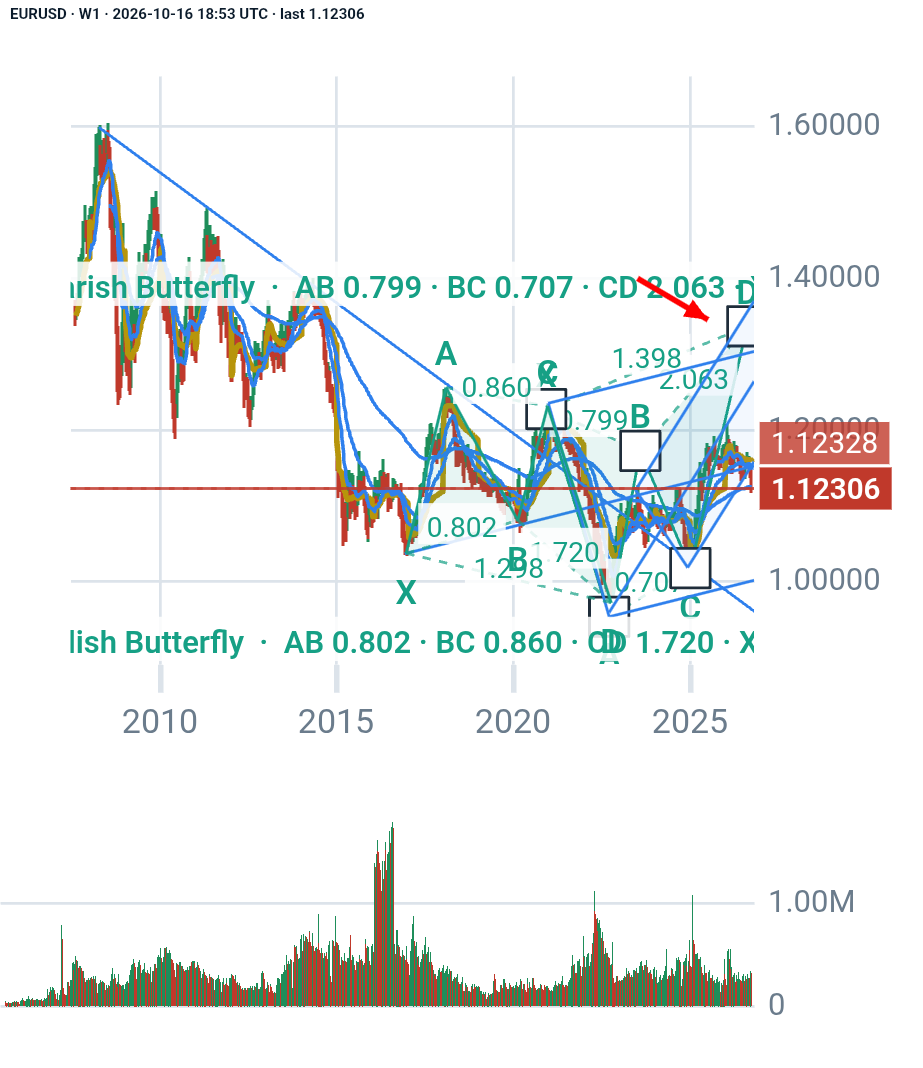
EURUSD · W1 Short

Is it going to be the next bearish butterfly?

What do you think? Is it going to be the next bearish butterfly? 🦋

Trader 3 weeks, 2 days पहले ♥ 0 💬 0

प्रकाशन के बाद से कीमत: -0.84% · आइडिया के पक्ष में

आइडिया उनके लेखकों की राय हैं, निवेश सलाह नहीं। कुछ भी आपत्तिजनक हो तो आइडिया पर ⚑ से रिपोर्ट करें।