Idées

Idées de trading

Des analyses graphiques publiées par des traders : ce qu’ils voient, où ils entreraient, leurs objectifs et leurs stops. Ouvrez n’importe quelle idée sur le graphique en direct, testez sa stratégie, suivez les personnes dont vous aimez les idées.

Créer un compte gratuit

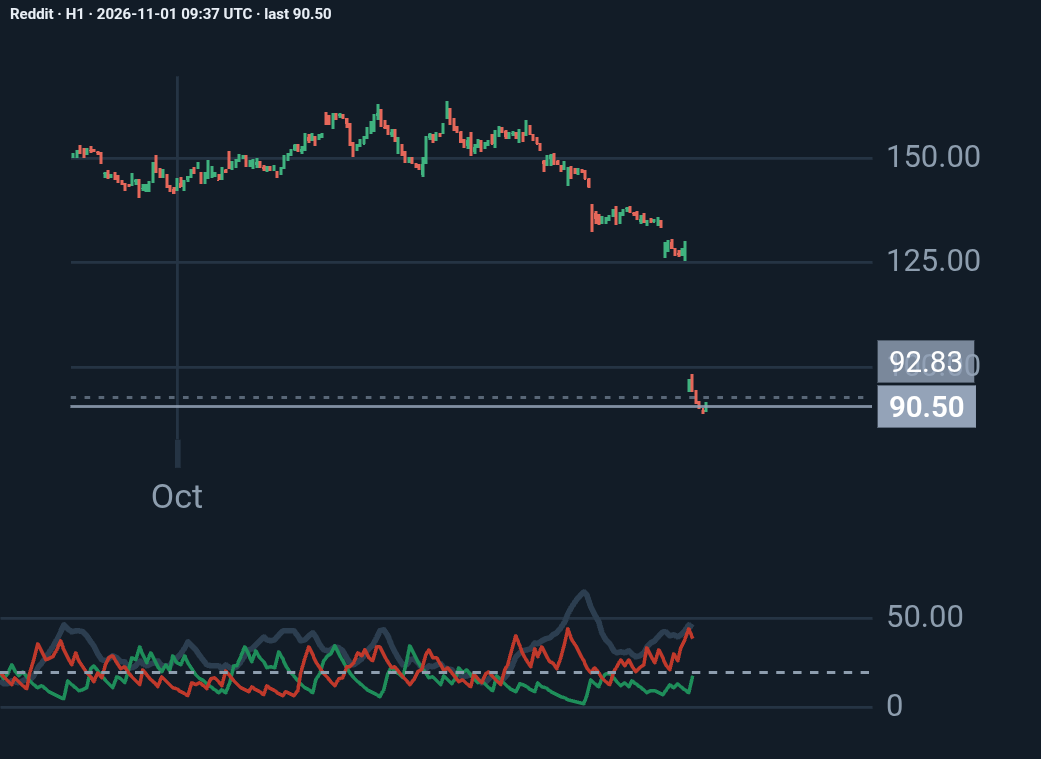
Reddit · H1 Neutral

Reddit H1: my analysis

Reddit lost about 30% of its market value on October 30, 2026, the day after its third-quarter earnings, because it admitted that traffic arriving from Google search has dropped si…

Trader il y a 1 week ♥ 0 💬 0

Prix depuis la publication : +3.69%

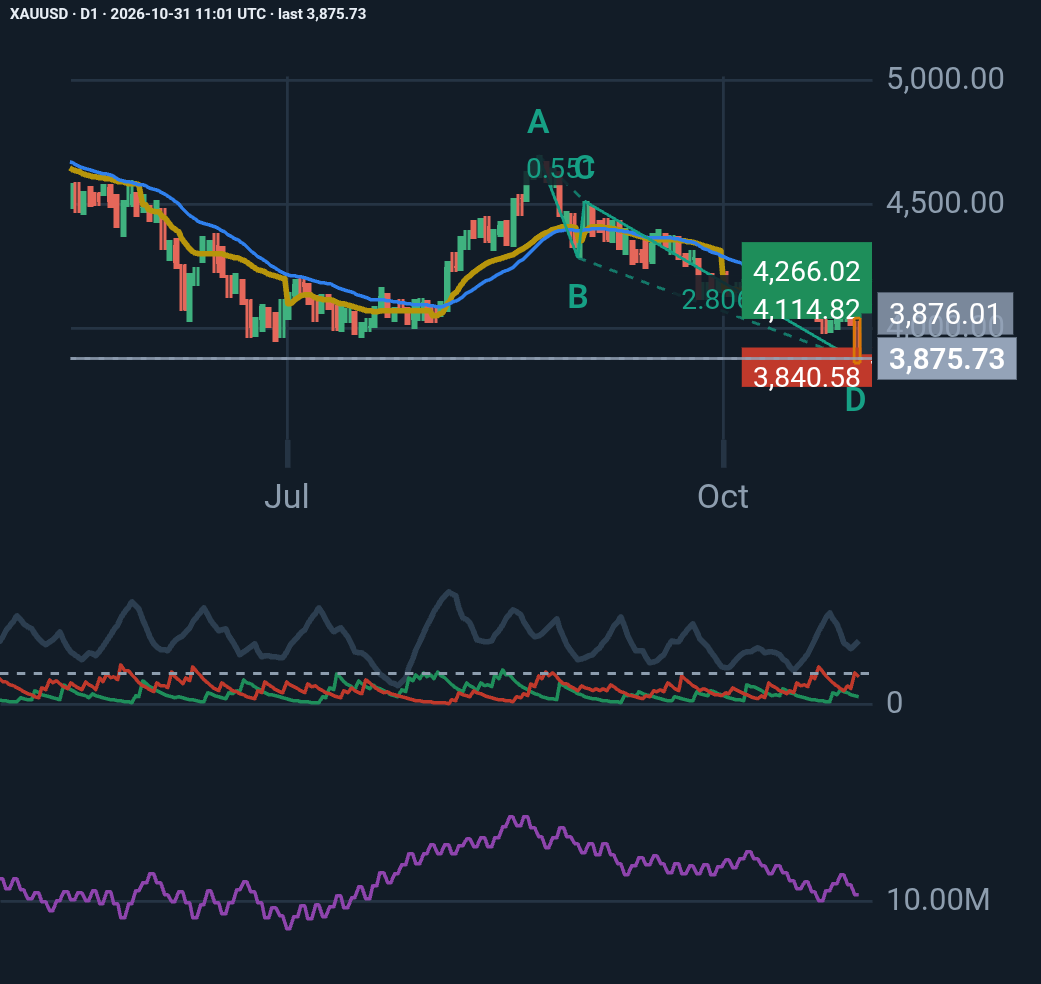
XAUUSD · D1 Long

Gold (XAUUSD) – Daily Technical Analysis | October 31, 2026

Gold is showing significant bearish momentum after a sharp decline, but an interesting bullish AB=CD harmonic pattern has emerged near the recent low of $3,870. Here are the key o…

Trader il y a 1 week, 1 day ♥ 0 💬 0

Prix depuis la publication : +5.04% · en faveur de l’idée

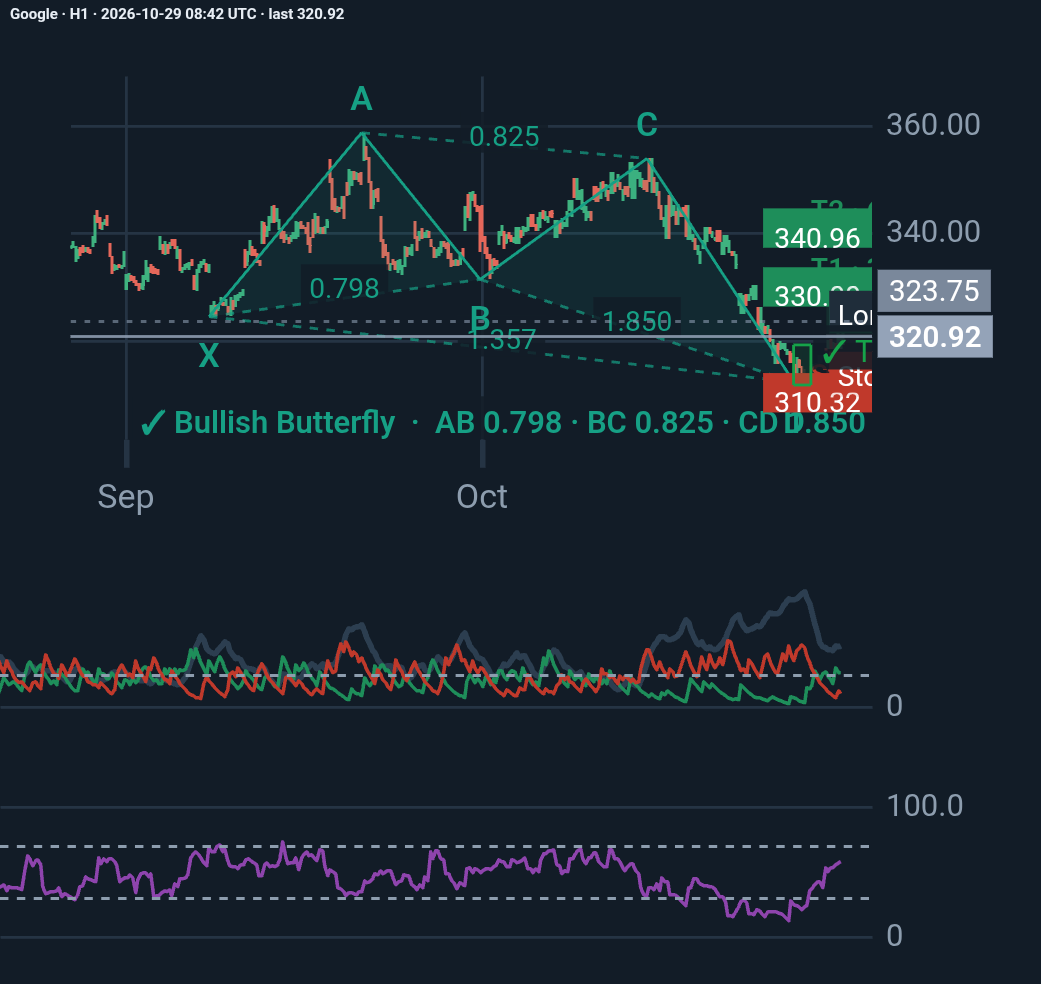
Google · H1 Long

Google (GOOGL) – Daily Technical Analysis | 29 October 2026

Google (GOOGL) – D1 Technical Analysis 📊 A potential bullish Butterfly pattern is forming near the $312–$319 support zone, supported by a possible Tweezer Bottom. 🎯 Upside target…

Trader il y a 1 week, 3 days ♥ 0 💬 0

Prix depuis la publication : -11.99% · contre l’idée

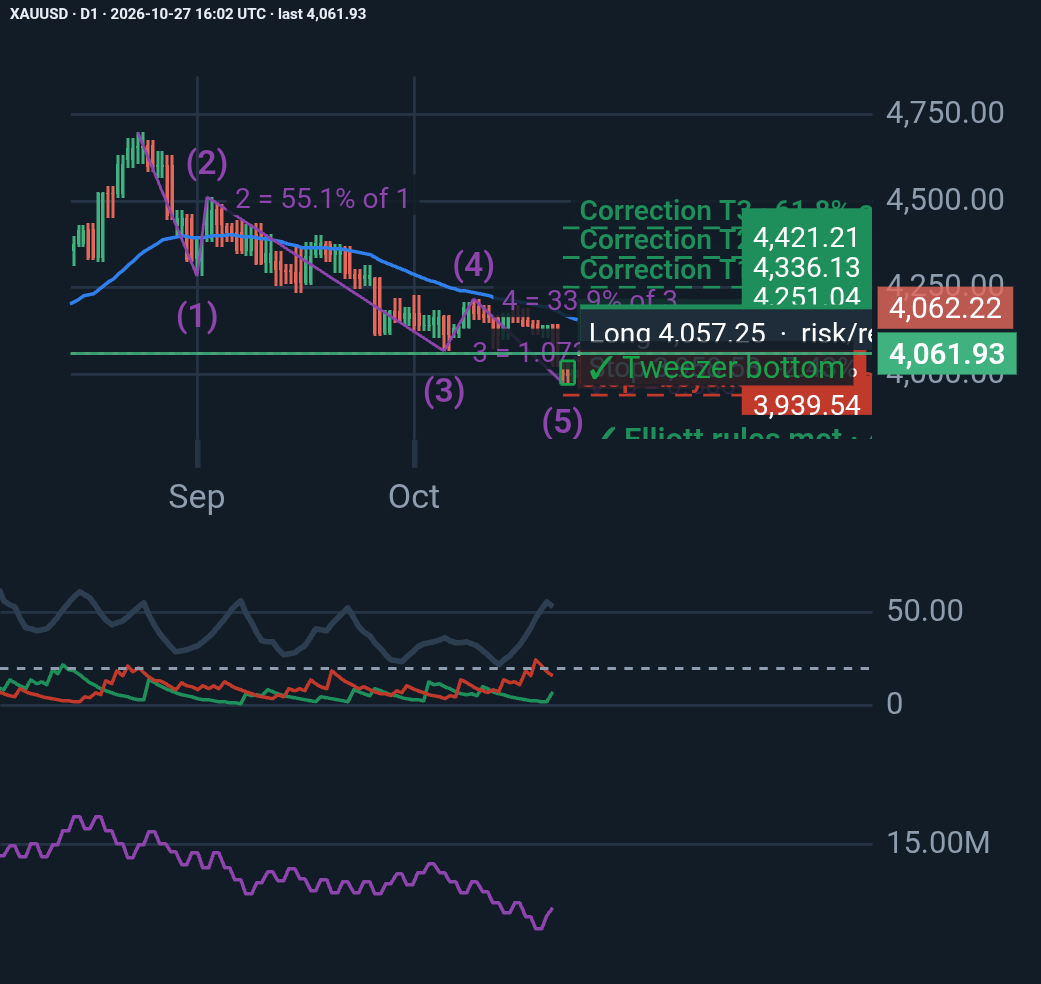
XAUUSD · D1 Long

XAUUSD D1 analysis

Gold (XAUUSD) | Daily Technical Analysis | October 26, 2026 Is gold preparing for a corrective rebound after a strong bearish move? On the daily chart, XAUUSD has declined from 4…

Trader il y a 1 week, 5 days ♥ 0 💬 0

Prix depuis la publication : +0.22% · en faveur de l’idée

Corning · D1 Long

Corning D1 analysis

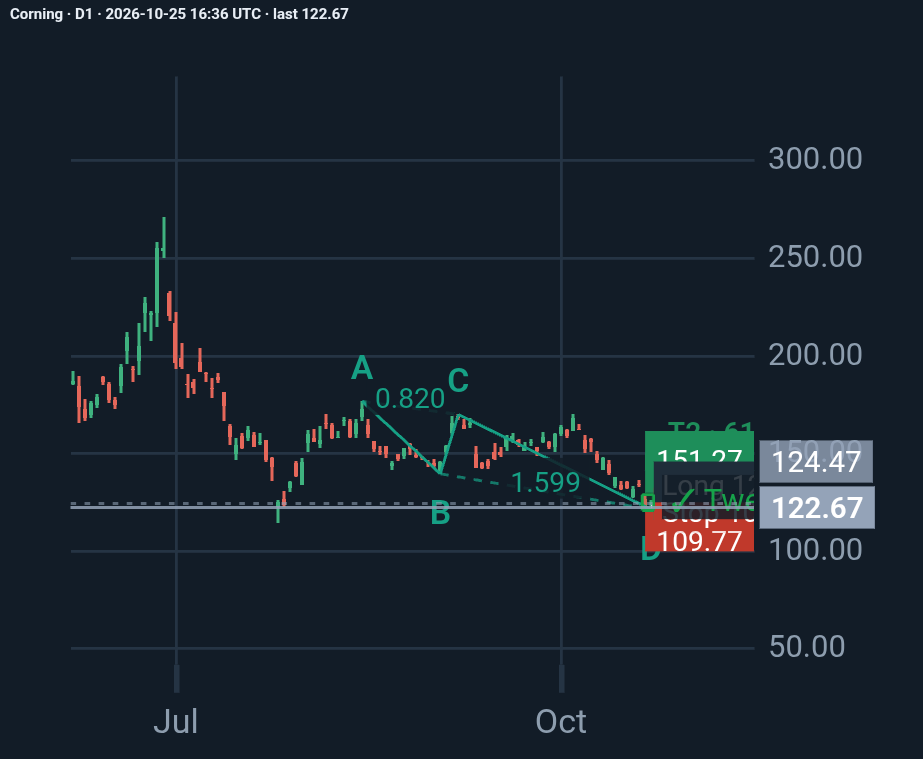
Corning Inc. (GLW) | Daily Chart Analysis: A Potential Bullish Reversal? Corning is approaching an important technical decision point, with a potential bullish AB=CD harmonic patt…

Trader il y a 2 weeks ♥ 0 💬 0

Prix depuis la publication : -14.19% · contre l’idée

AmericanTower · D1 Neutral

AmericanTower D1 analysis

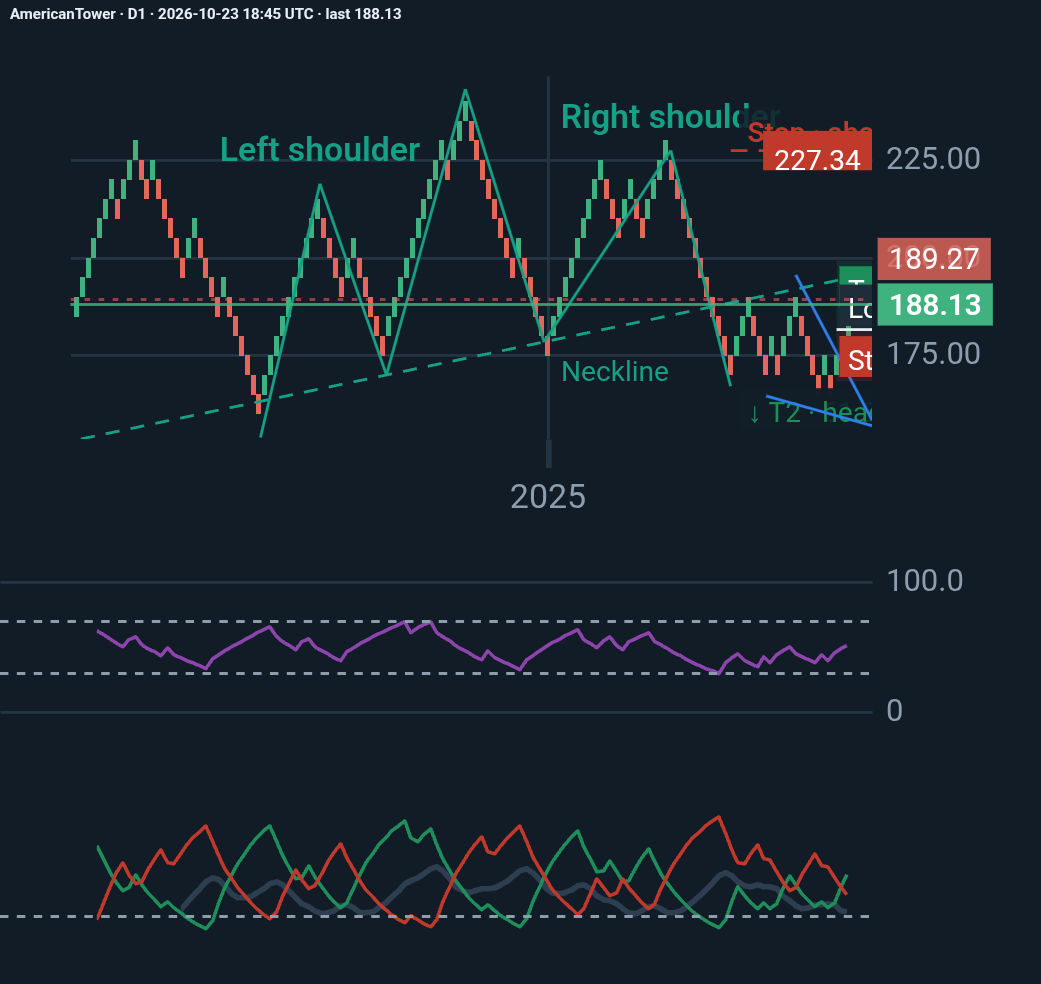
American Tower (AMT): A recovery within a potentially bearish structure. American Tower is showing improving short-term momentum, but the broader technical picture remains uncerta…

Trader il y a 2 weeks, 2 days ♥ 0 💬 0

Prix depuis la publication : +0.03%

JP225-DEC26 · D1 Short

JP225-DEC26 D1 analysis

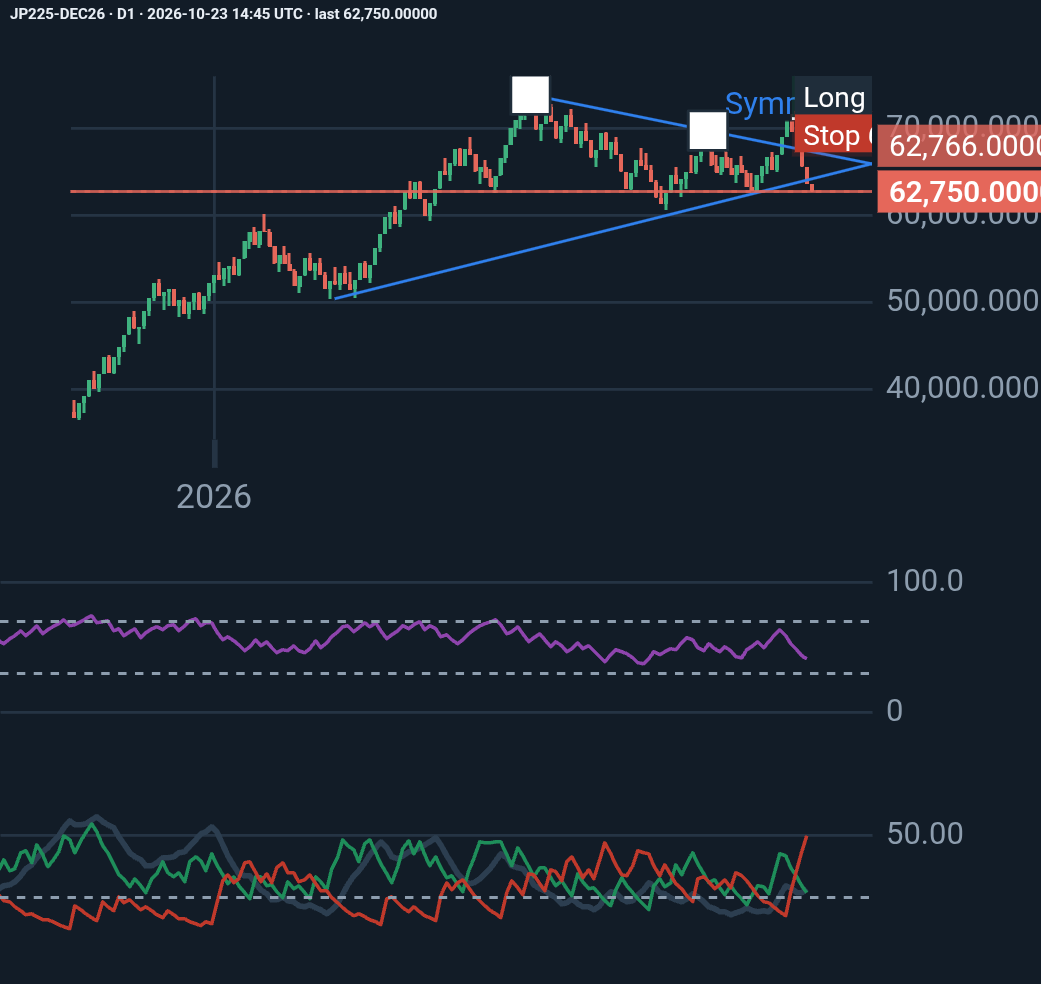
JP225-DEC26 Technical Outlook 📊 The Nikkei 225 futures chart shows increasing bearish pressure, with RSI at 41.82 and −DI significantly above +DI. Price is approaching a key suppo…

Trader il y a 2 weeks, 2 days ♥ 0 💬 0

Prix depuis la publication : -7.19% · en faveur de l’idée

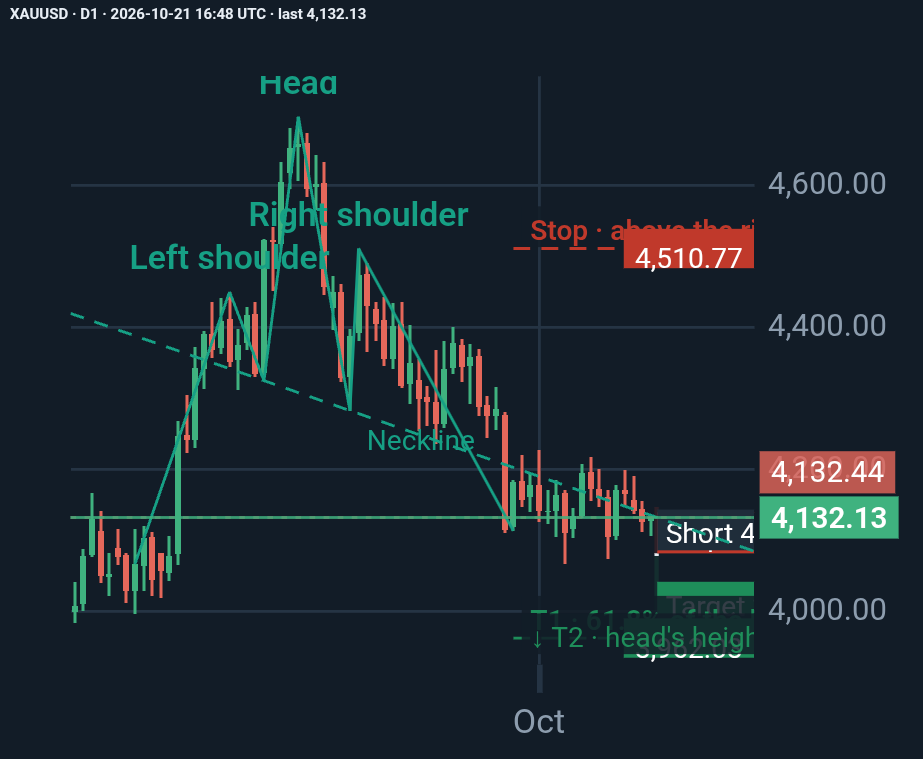
XAUUSD · D1 Short

XAUUSD HEAD AND SHOULDERS

The short (entry 4,079.66, stop 4,146.69, target 3,977.89) is the more actionable idea. Entry sits below the 4,105–4,115 decision zone; target aligns with the next demand shelf; st…

Trader il y a 2 weeks, 4 days ♥ 0 💬 0

Prix depuis la publication : -1.48% · en faveur de l’idée

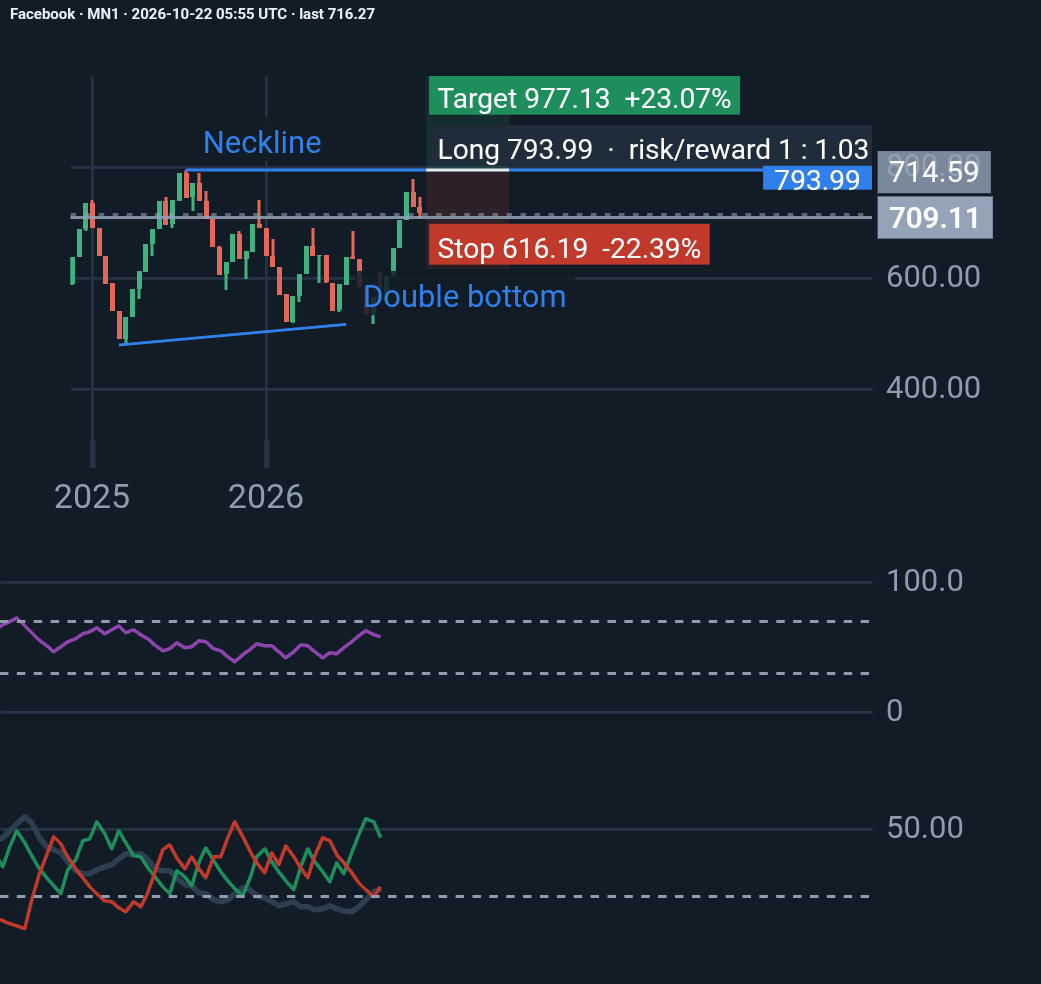
Facebook · MN1 Long

Facebook MN1 analysis

Entry on a close through the middle high; stop 60% back into the pattern (the cautious stop is beyond the lows, 454.62).

Trader il y a 2 weeks, 3 days ♥ 0 💬 0

Prix depuis la publication : -14.41% · contre l’idée

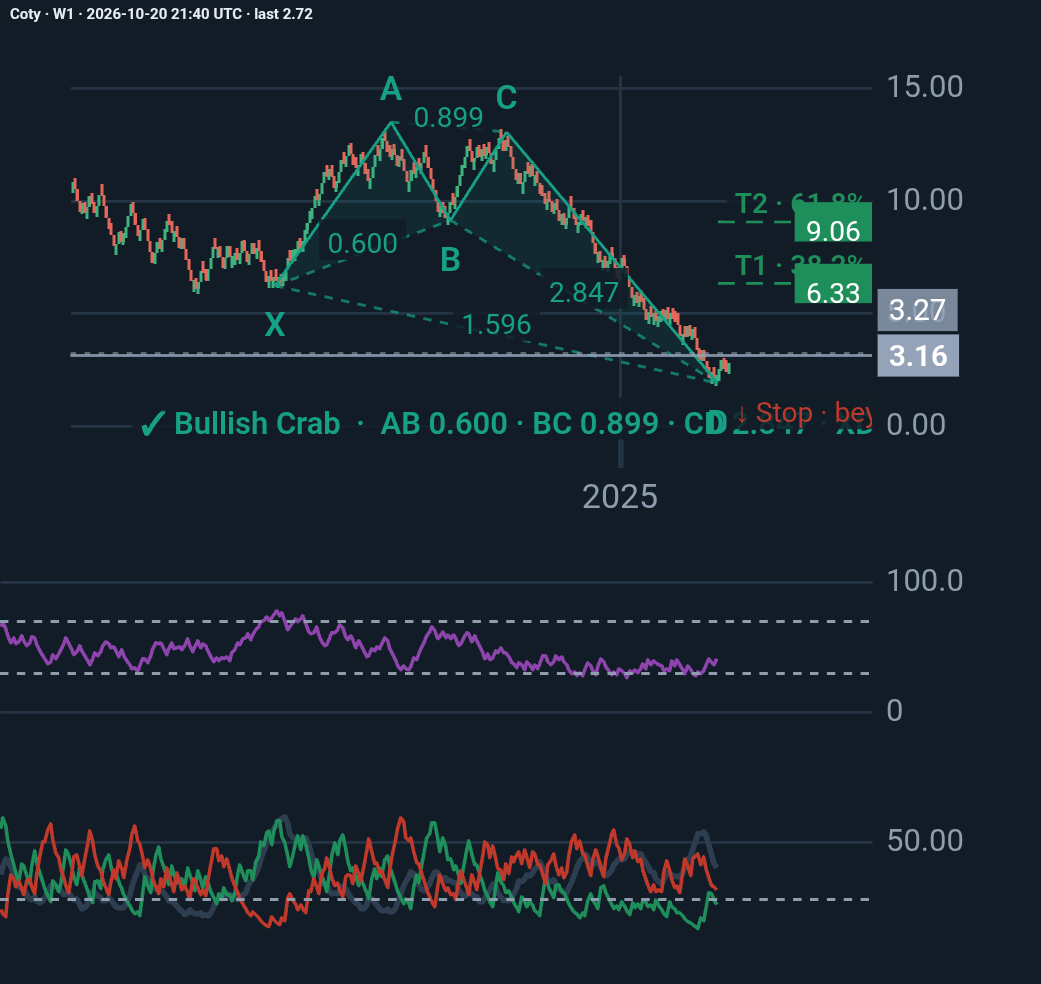
Coty · W1 Long

Coty W1 analysis

Coty’s weekly chart suggests a potential bullish recovery from the Crab harmonic completion near $1.91, with targets at $6.33 and $9.06. However, RSI at 41.19 and −DI above +DI ind…

Trader il y a 2 weeks, 5 days ♥ 0 💬 0

Prix depuis la publication : +25.00% · en faveur de l’idée

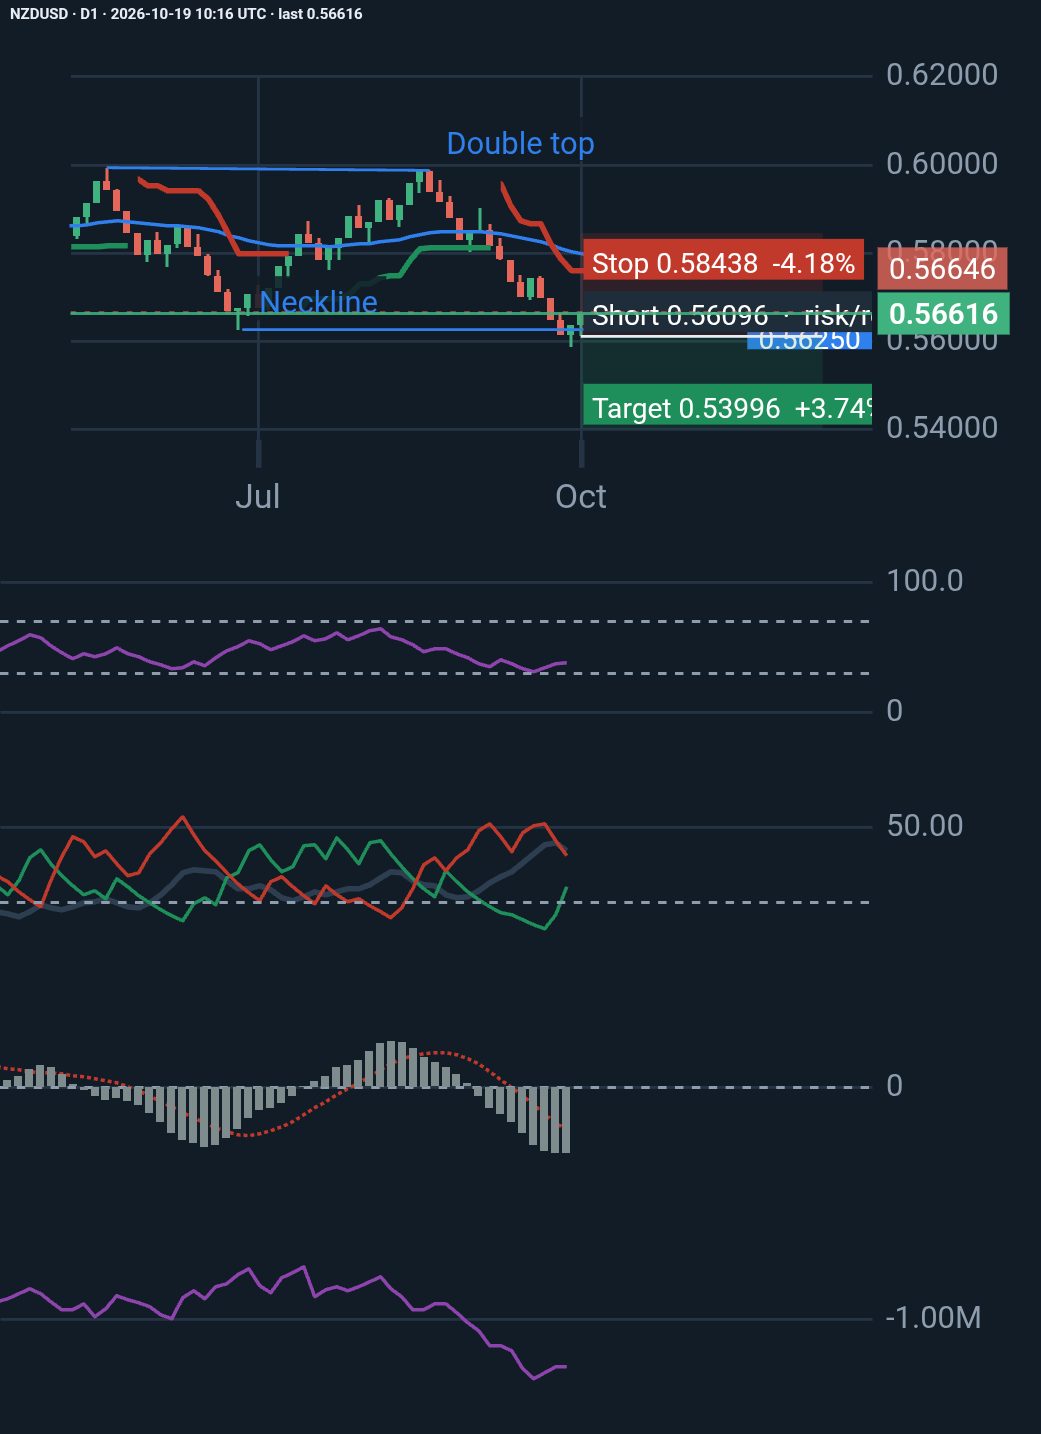
NZDUSD · D1 Long

NZDUSD D1 analysis

📉 NZDUSD Technical Analysis | Daily Chart NZDUSD maintains a bearish bias, trading at 0.56615 below the 50-day EMA (0.5771) and SuperTrend (0.5745). 🔎 Key observations: - RSI (3…

Trader il y a 2 weeks, 6 days ♥ 0 💬 0

Prix depuis la publication : -2.13% · contre l’idée

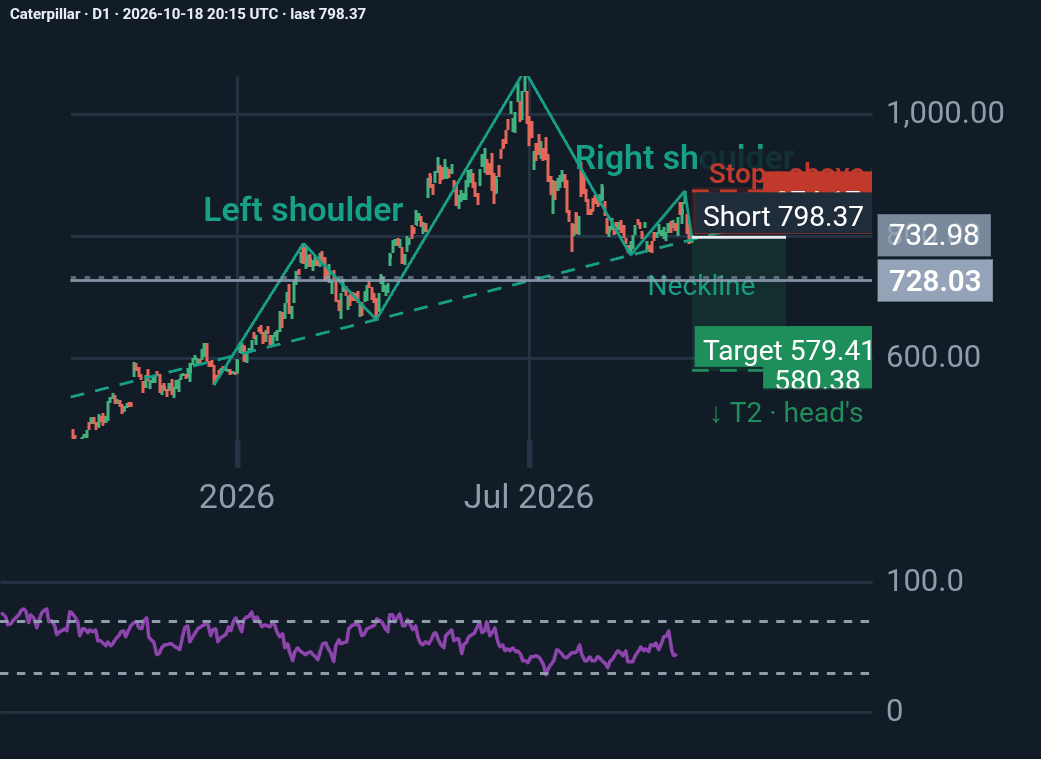
Caterpillar · D1 Short

CAT

Caterpillar’s chart suggests a bearish reversal, with the head-and-shoulders pattern indicating potential downside toward 580 or even 448. However, price at 798.37 is above the sta…

Trader il y a 3 weeks ♥ 0 💬 0

Prix depuis la publication : -23.63% · en faveur de l’idée

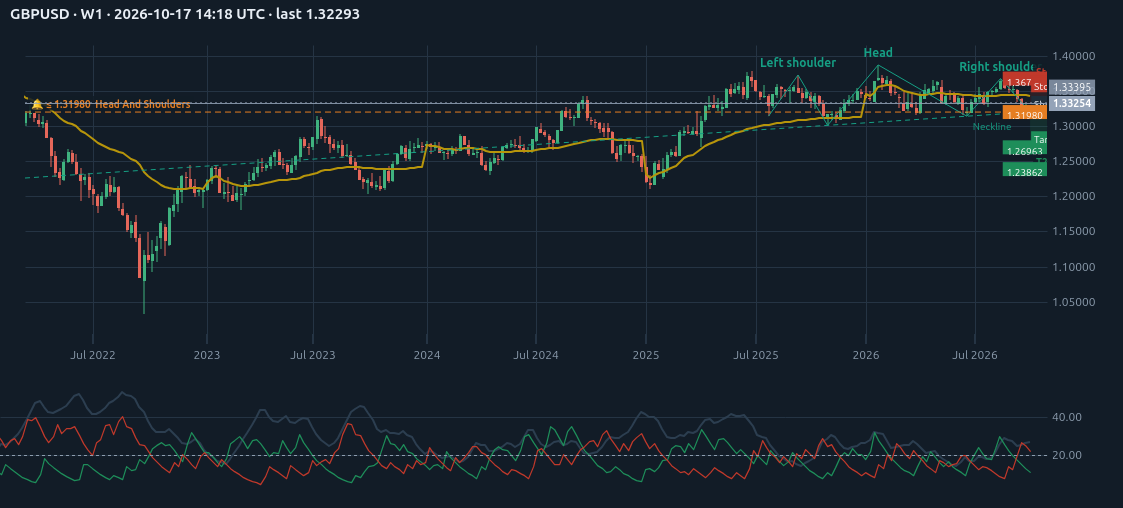
GBPUSD · W1 Short

GBPUSD W1 analysis

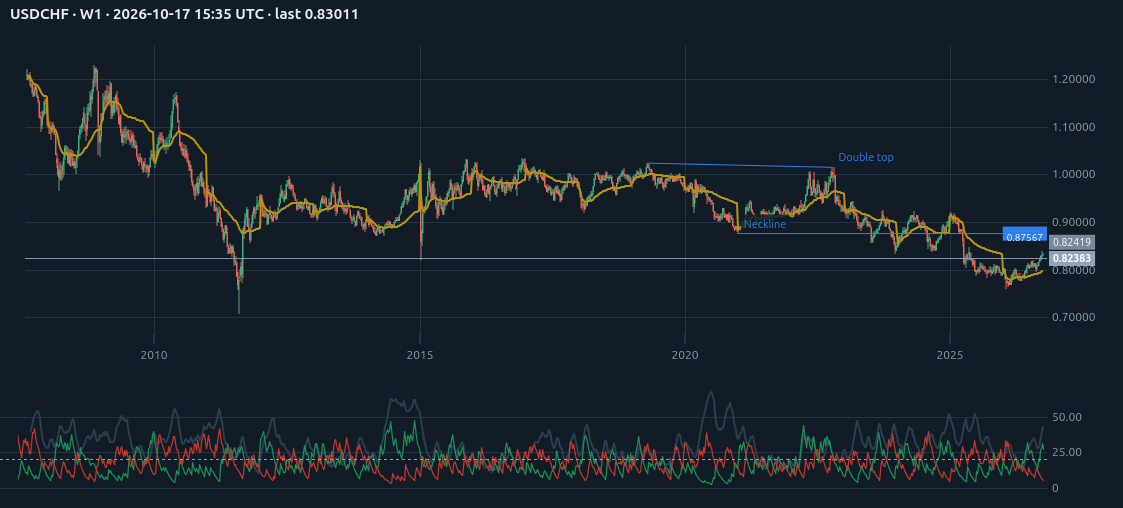
Watch the neckline at 1.31981 · small swings ▼ Short 1.31981 · stop order (on the breakout) Stop 1.37144 (3.91%)T1 1.26963 · R:R 1:0.97T2 1.23862 · R:R 1:1.57 Entry on a close thro…

Trader il y a 3 weeks, 1 day ♥ 0 💬 0

Prix depuis la publication : +0.16% · contre l’idée

Les idées sont les opinions de leurs auteurs, pas des conseils en investissement. Signalez tout abus avec ⚑ sur l’idée.