
SOLV Energy (NASDAQ: MWH): A bullish reversal on the horizon?
 Trader @trader
2 Nov 2026, 11:20 UTC
 Ouvrir sur le graphique en direct ↗
Prix à la publication : 22.740000 · maintenant 25.180000 (+10.73%, en faveur de l’idée)
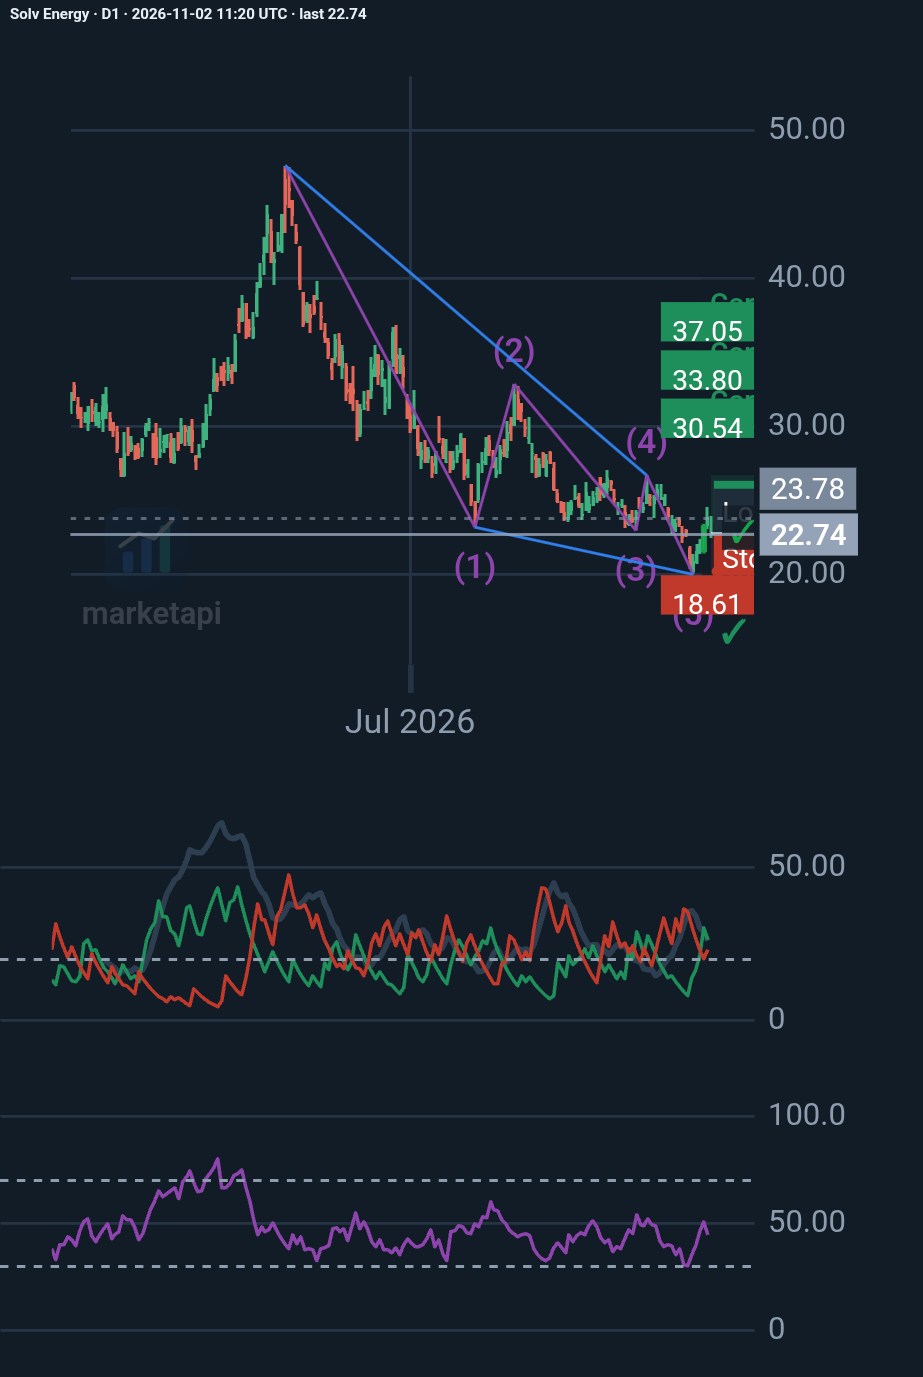
My D1 analysis identifies a potential Elliott Wave ending diagonal, suggesting the prolonged decline may be approaching exhaustion.
Key levels:
• $19.99 – Critical support
• $23.91 – Initial bullish confirmation
• $26.69 – First upside target
• $30.54 – Extended target
The Pattern Wizard identified the pattern with an 89/100 quality score.
Its historical backtest across 1,945 trades shows a statistically significant edge at the 99% confidence level, with +0.21R average expectancy.
A recovery is possible, but confirmation is still needed.
#SOLV #TechnicalAnalysis #ElliottWave #Trading #MarketAPI
Mises à jour de l’auteur
Plus de Trader
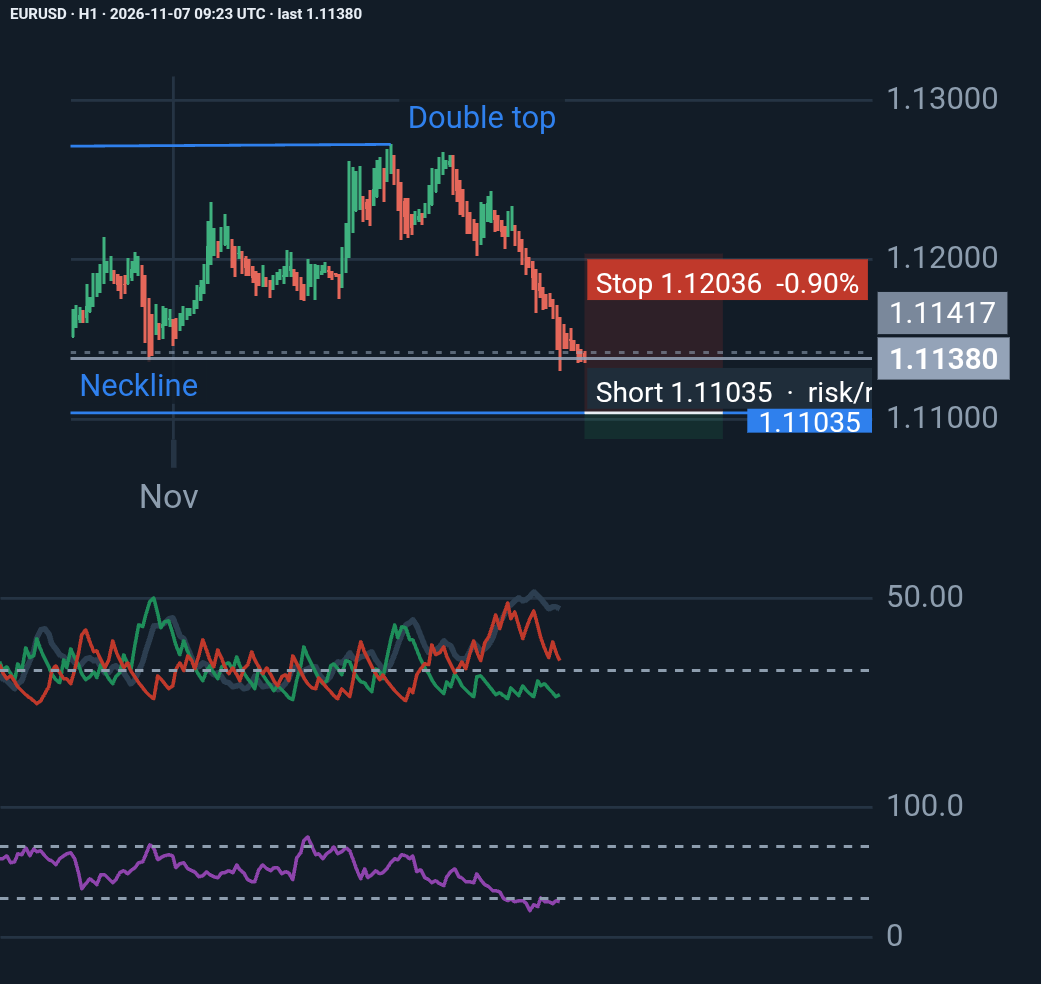
EURUSD H1: Bears Remain in Control, but Is a Reversal Approaching?
EURUSD remains under strong bearish pressure, with ADX at 45.88 and -DI (24.08) significantly above +DI (10.21). RSI at 27.06 signals oversold conditions, raising the possibility …
Trader
il y a 1 day, 17 hours
♥ 0 💬 0
Prix depuis la publication : +0.14% · en faveur de l’idée
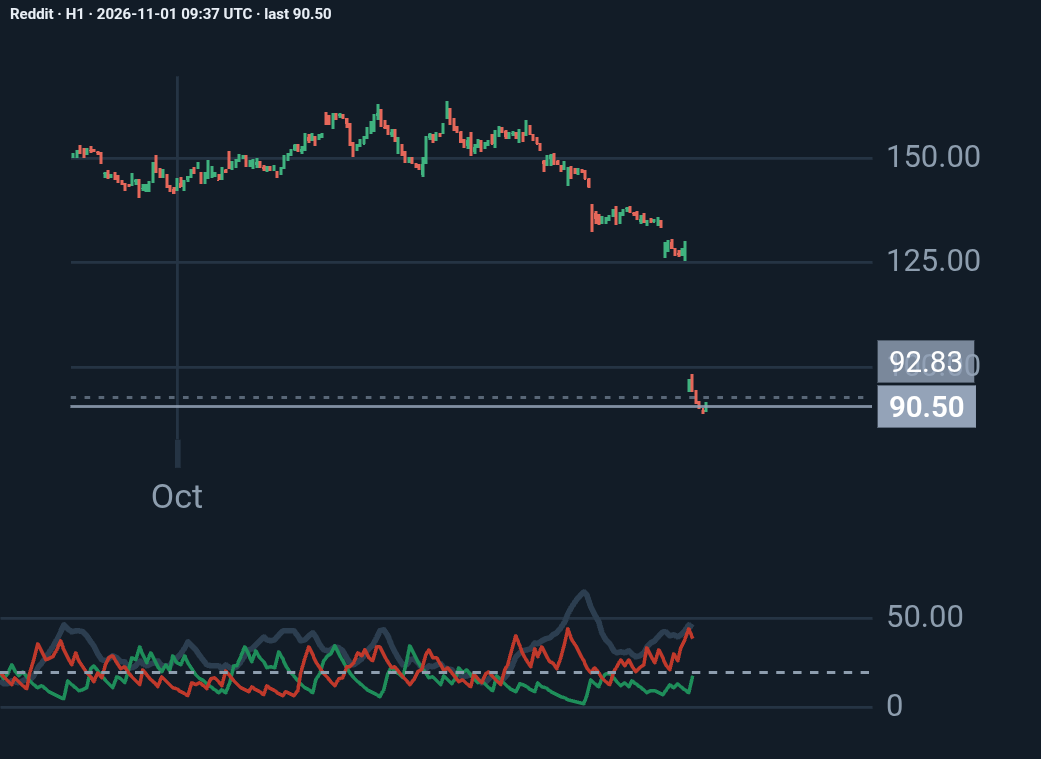
Reddit H1: my analysis
Reddit lost about 30% of its market value on October 30, 2026, the day after its third-quarter earnings, because it admitted that traffic arriving from Google search has dropped si…
Trader
il y a 1 week
♥ 0 💬 0
Prix depuis la publication : +3.69%
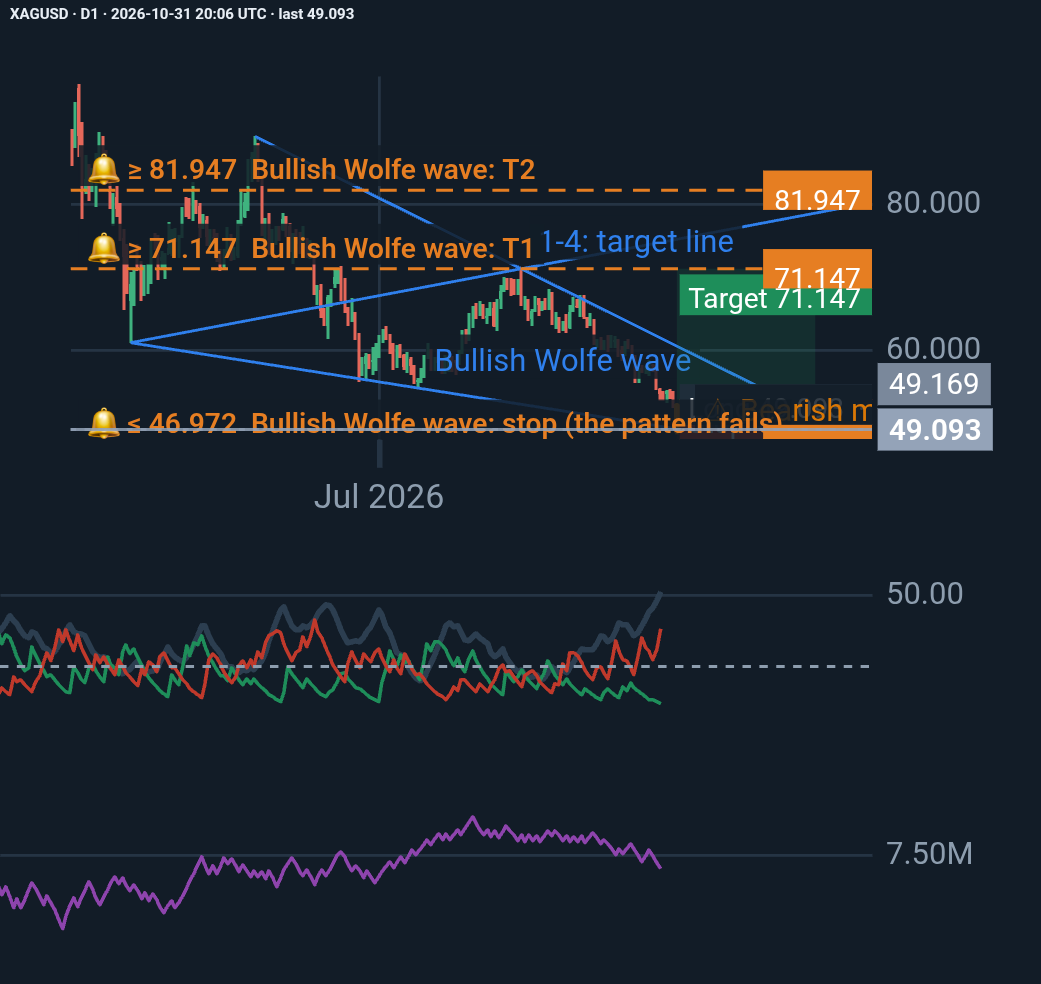
Silver (XAGUSD) – A Potential Bullish Reversal at a Critical Technical Zone
Silver has experienced a significant daily decline, with the latest session closing at 49.093, almost exactly at the projected Point 5 of a bullish Wolfe Wave pattern. Despite str…
Trader
il y a 1 week, 1 day
♥ 0 💬 0
Prix depuis la publication : +7.98%
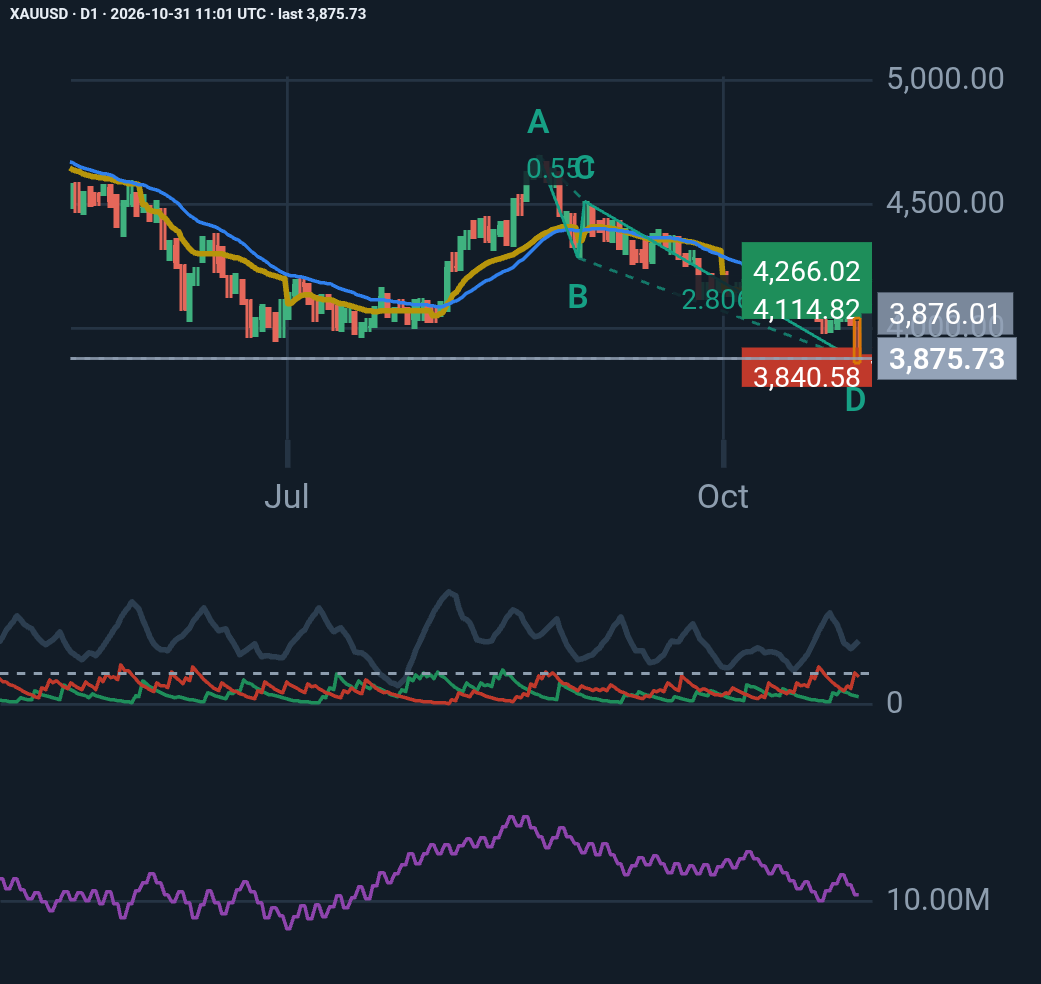
Gold (XAUUSD) – Daily Technical Analysis | October 31, 2026
Gold is showing significant bearish momentum after a sharp decline, but an interesting bullish AB=CD harmonic pattern has emerged near the recent low of $3,870. Here are the key o…
Trader
il y a 1 week, 1 day
♥ 0 💬 0
Prix depuis la publication : +6.27% · en faveur de l’idée
Les idées sont l’opinion de leur auteur, pas des conseils en investissement. Les mouvements passés ne prédisent pas les suivants.
Commentaires 0
Connectez-vous ou créez un compte gratuit pour aimer, suivre et commenter.