
ExxonMobil (XOM) shows bullish potential toward $190–$202, with momentum favouring buyers, but breakout confirmation and
 Trader @trader
19 Oct 2026, 10:36 UTC
 लाइव चार्ट पर खोलें ↗
प्रकाशन के समय कीमत: 178.610000 · अभी 165.410000 (-7.39%, आइडिया के विरुद्ध)
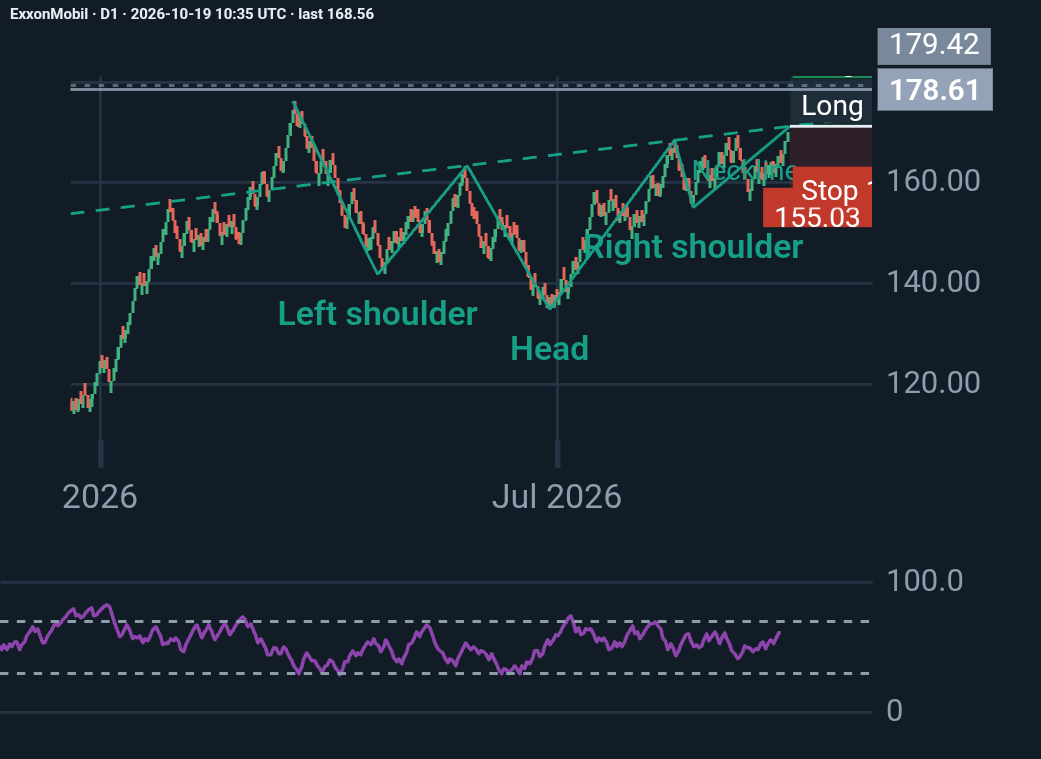
📊 ExxonMobil (XOM) | Daily Technical Analysis
ExxonMobil is showing a potentially bullish technical setup, with an inverse Head and Shoulders pattern suggesting further upside if the breakout holds.
🔹 RSI (14): 61.69, indicating positive momentum without being overbought.
🔹 Key breakout level: $171.16
🔹 Target 1: $189.98
🔹 Target 2: $201.65
🔹 Critical support: $163–$168
🔹 Risk level: A break below the right shoulder near $155 could weaken the bullish structure.
The price has moved above the planned breakout entry, so chasing the rally may offer a less attractive risk/reward ratio. A successful retest of former resistance could provide a more constructive setup.
📈 My view: Bullish, but confirmation and disciplined risk management remain essential. Earnings-related volatility and data consistency should also be considered.
What’s your outlook for XOM — continued upside or a pullback before the next move?
#ExxonMobil #XOM #TechnicalAnalysis #StockMarket #Trading #RSI #PriceAction #Investing
लेखक के अपडेट
Trader से और
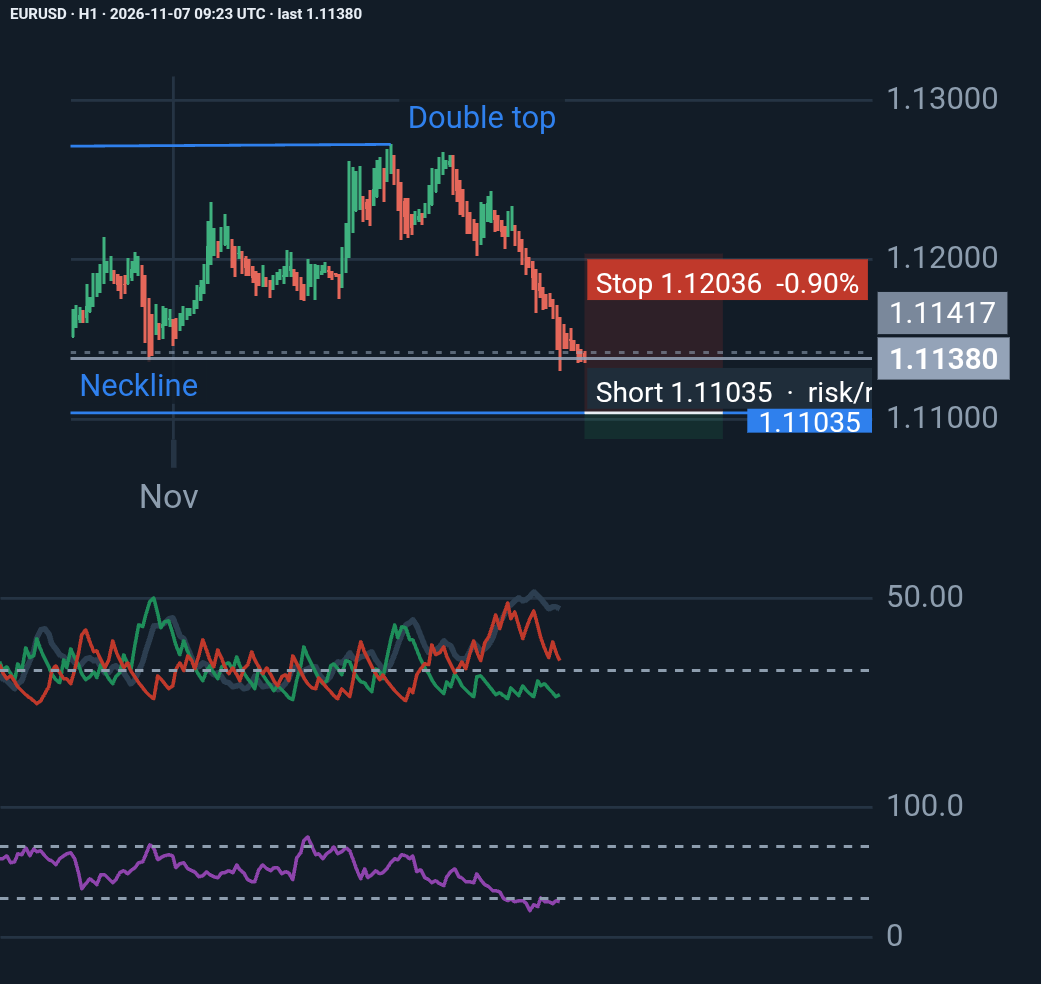
EURUSD H1: Bears Remain in Control, but Is a Reversal Approaching?
EURUSD remains under strong bearish pressure, with ADX at 45.88 and -DI (24.08) significantly above +DI (10.21). RSI at 27.06 signals oversold conditions, raising the possibility …
Trader
1 day, 17 hours पहले
♥ 0 💬 0
प्रकाशन के बाद से कीमत: +0.15% · आइडिया के पक्ष में
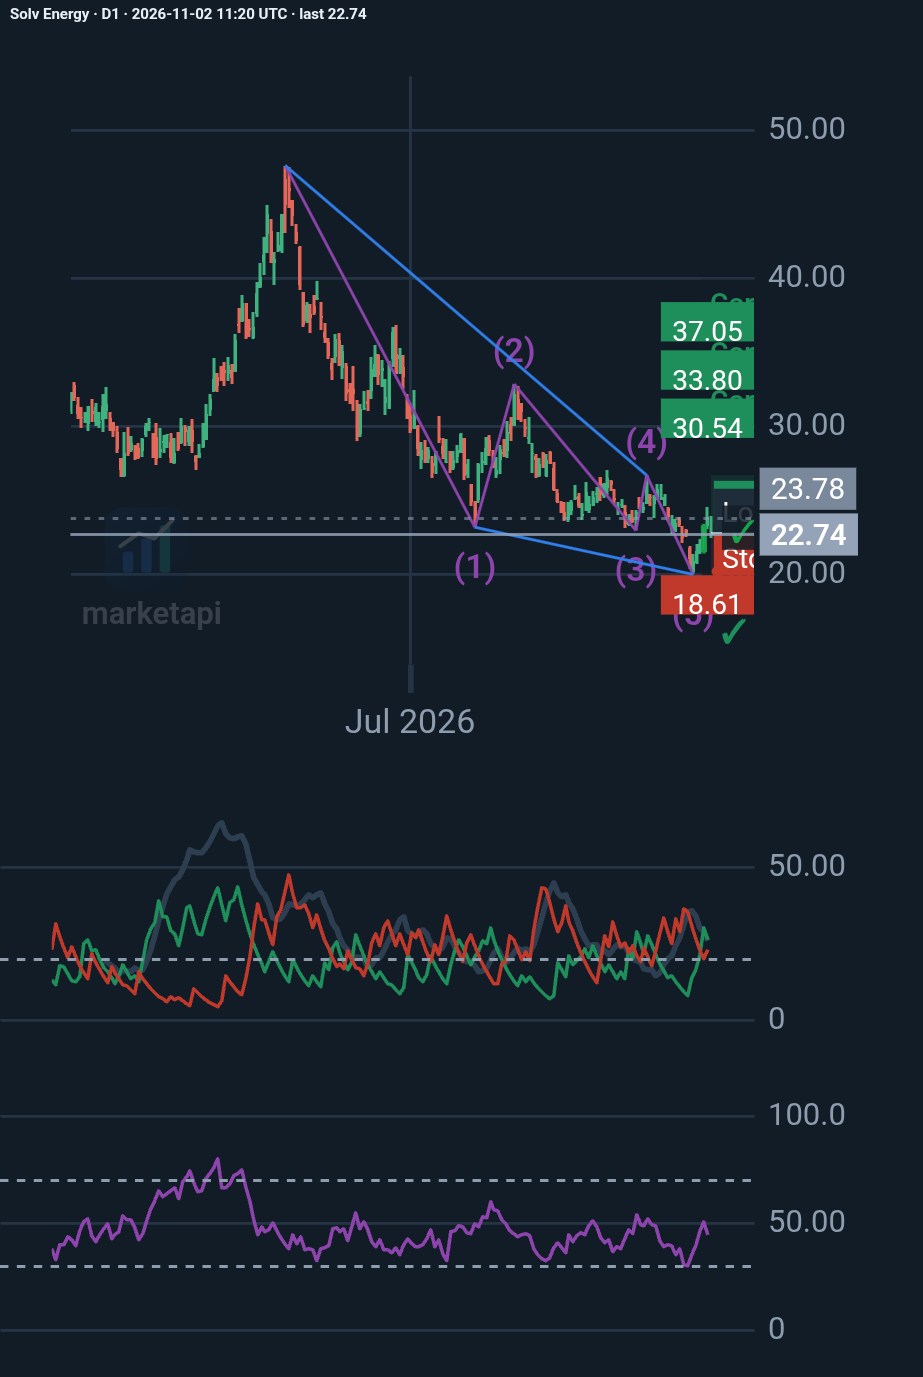
SOLV Energy (NASDAQ: MWH): A bullish reversal on the horizon?
My D1 analysis identifies a potential Elliott Wave ending diagonal, suggesting the prolonged decline may be approaching exhaustion. Key levels: • $19.99 – Critical support • $23.9…
Trader
6 days, 15 hours पहले
♥ 0 💬 0
प्रकाशन के बाद से कीमत: +10.73% · आइडिया के पक्ष में
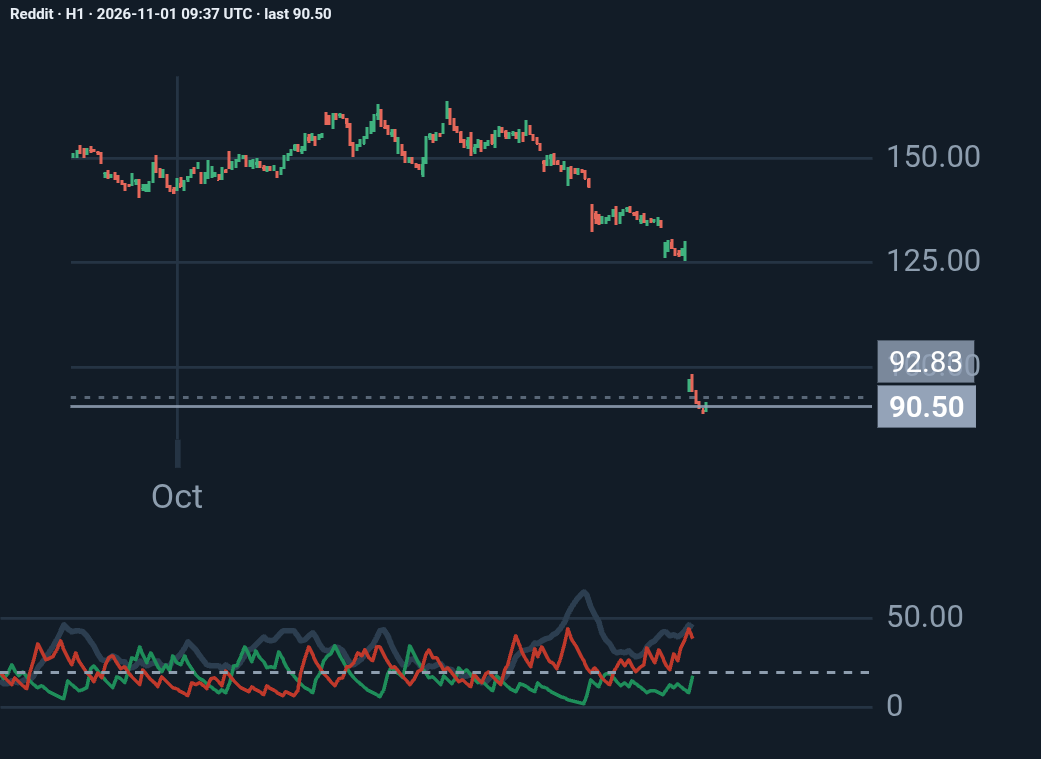
Reddit H1: my analysis
Reddit lost about 30% of its market value on October 30, 2026, the day after its third-quarter earnings, because it admitted that traffic arriving from Google search has dropped si…
Trader
1 week पहले
♥ 0 💬 0
प्रकाशन के बाद से कीमत: +3.69%
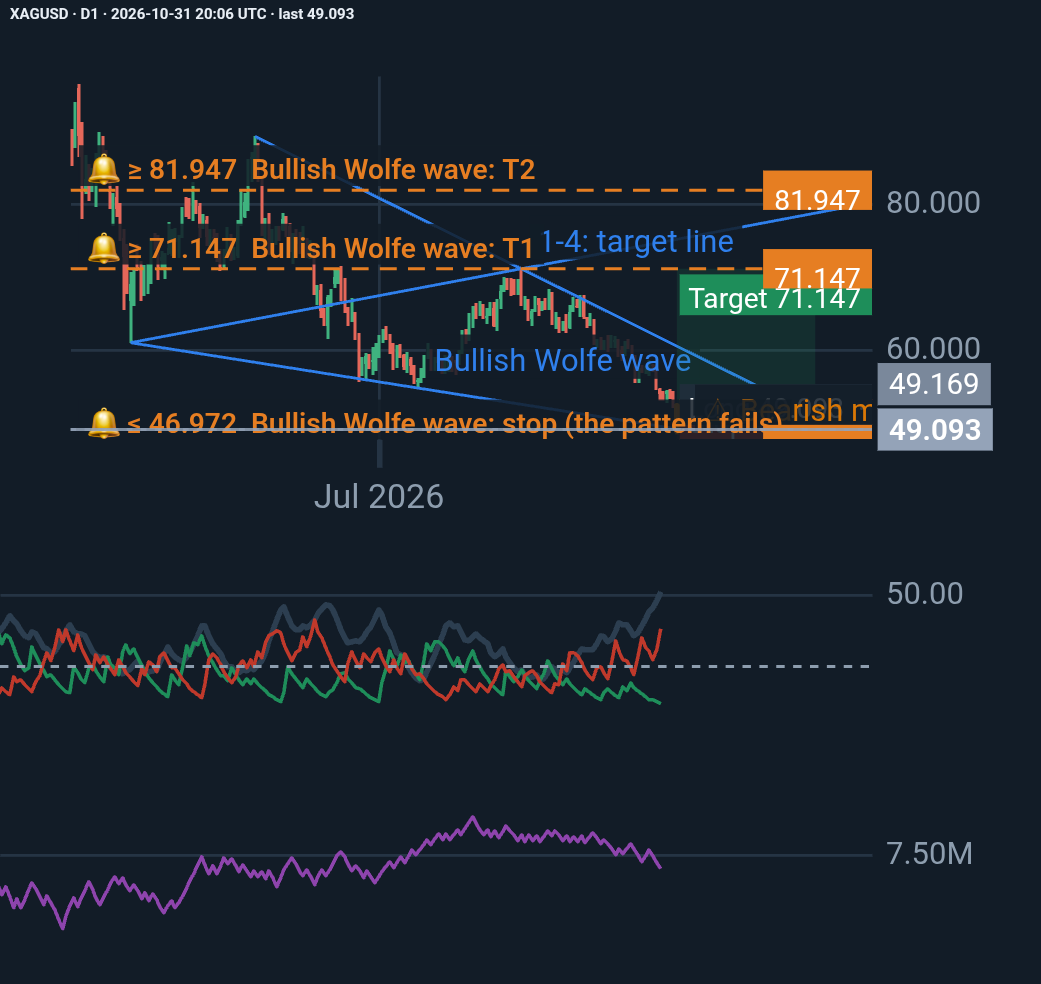
Silver (XAGUSD) – A Potential Bullish Reversal at a Critical Technical Zone
Silver has experienced a significant daily decline, with the latest session closing at 49.093, almost exactly at the projected Point 5 of a bullish Wolfe Wave pattern. Despite str…
Trader
1 week, 1 day पहले
♥ 0 💬 0
प्रकाशन के बाद से कीमत: +7.81%
आइडिया लेखक की राय है, निवेश सलाह नहीं। पिछली चालें भविष्य का अनुमान नहीं लगातीं।
कमेंट 0
लाइक, फ़ॉलो और कमेंट करने के लिए साइन इन करें या मुफ़्त खाता बनाएँ।