
NZDUSD D1 analysis
 Trader @trader
19 Oct 2026, 10:16 UTC
 Open on the live chart ↗
Price when published: 0.566170 · now 0.556380 (-1.73%, against the idea)
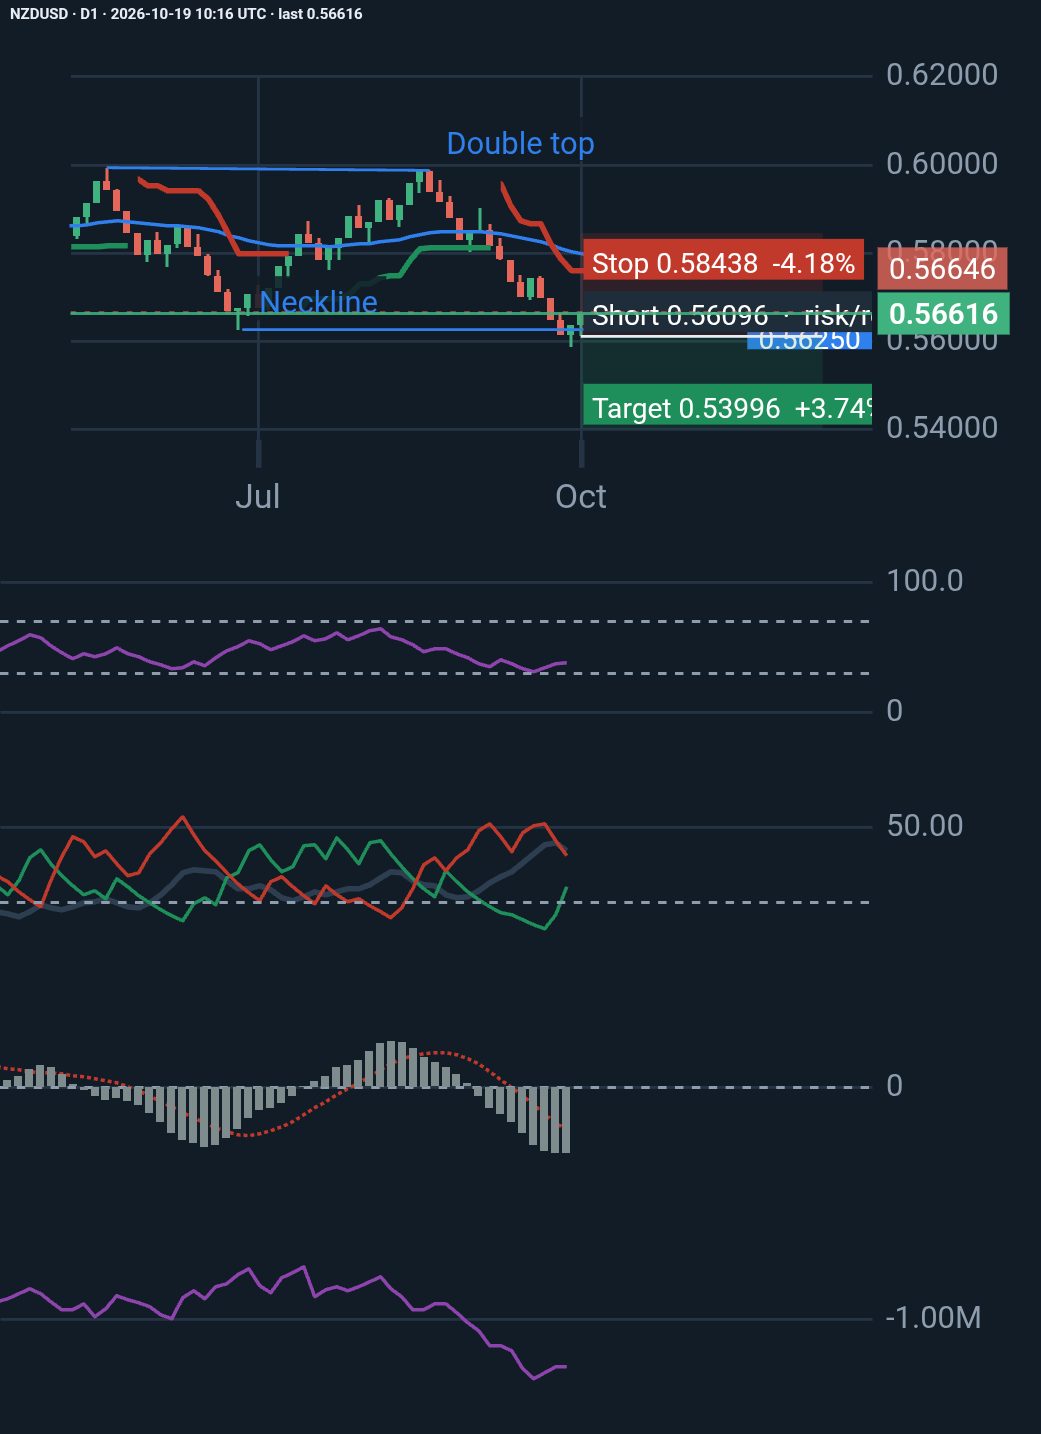
📉 NZDUSD Technical Analysis | Daily Chart
NZDUSD maintains a bearish bias, trading at 0.56615 below the 50-day EMA (0.5771) and SuperTrend (0.5745).
🔎 Key observations:
- RSI (37.62) and MACD indicate bearish momentum.
- ADX (72.51) suggests a strong trend, with sellers dominating.
- A potential double-top pattern formed near 0.5990.
- The neckline at 0.56250 remains the key confirmation level.
📊 What’s next?
A daily close below 0.56250, followed by a failed retest, could open the way toward 0.55847 and potentially lower levels. Holding support may trigger a rebound toward 0.5745–0.5771.
⚠️ The bearish setup remains unconfirmed until the neckline breaks decisively. Risk management is essential, especially given the current trade’s 0.90:1 reward-to-risk ratio.
What’s your outlook for NZDUSD — further downside or a potential rebound?
#NZDUSD #Forex #TechnicalAnalysis #Trading #PriceAction #RiskManagement
Updates from the author
More from Trader
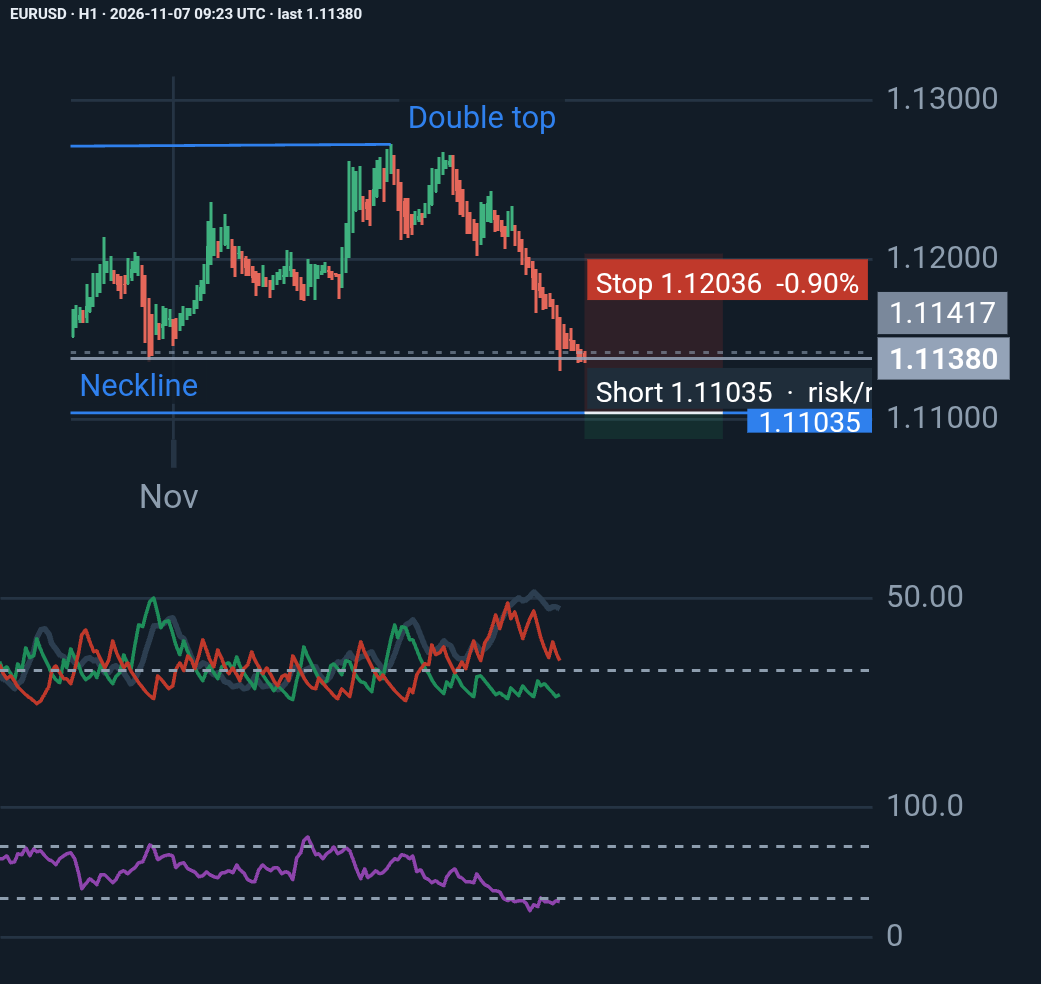
EURUSD H1: Bears Remain in Control, but Is a Reversal Approaching?
EURUSD remains under strong bearish pressure, with ADX at 45.88 and -DI (24.08) significantly above +DI (10.21). RSI at 27.06 signals oversold conditions, raising the possibility …
Trader
1 day, 15 hours ago
♥ 0 💬 0
Price since published: +0.07% · in the idea's favour
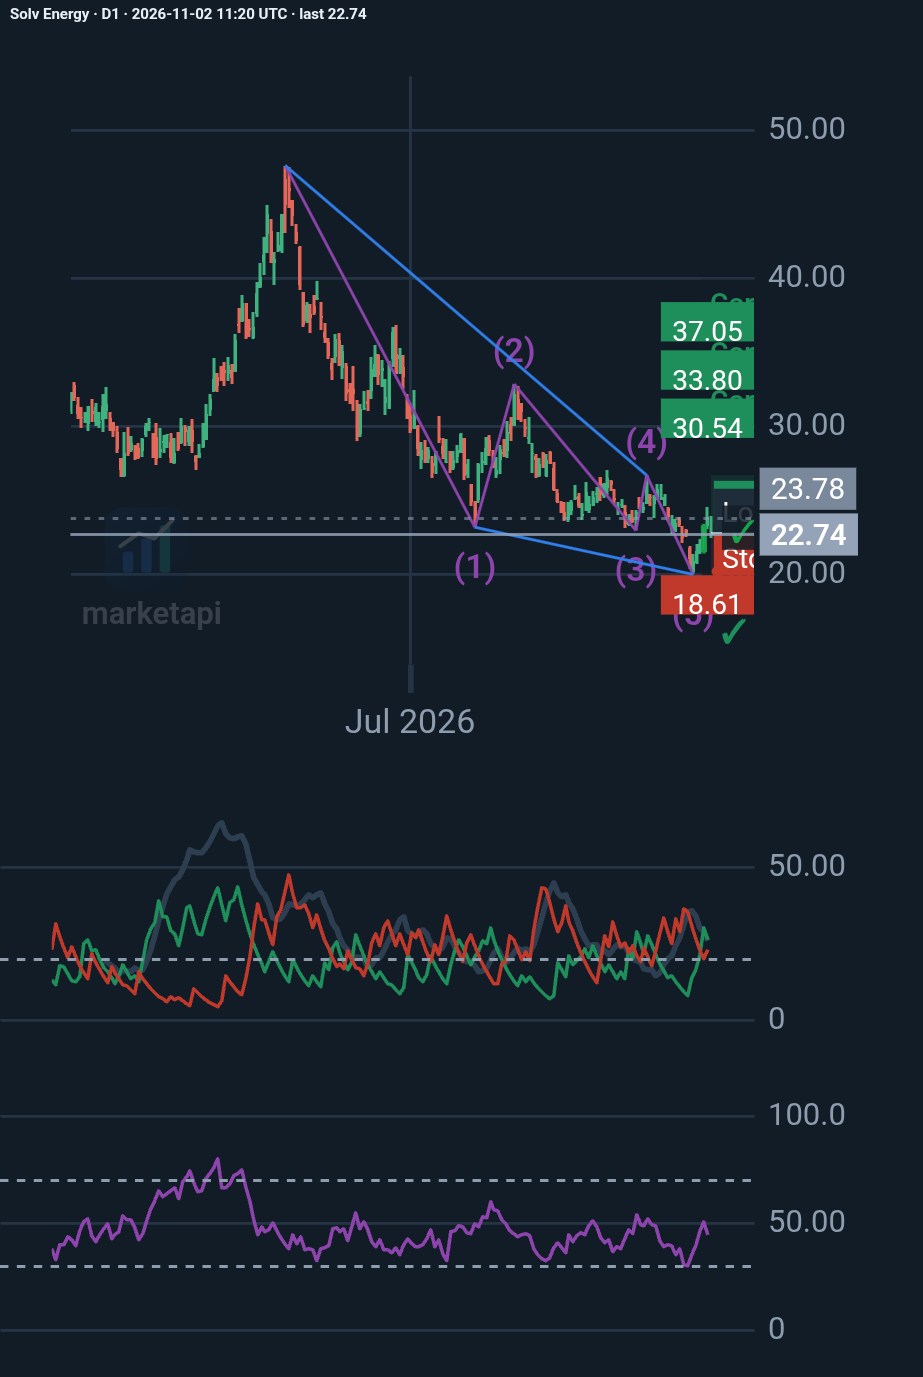
SOLV Energy (NASDAQ: MWH): A bullish reversal on the horizon?
My D1 analysis identifies a potential Elliott Wave ending diagonal, suggesting the prolonged decline may be approaching exhaustion. Key levels: • $19.99 – Critical support • $23.9…
Trader
6 days, 13 hours ago
♥ 0 💬 0
Price since published: +10.73% · in the idea's favour
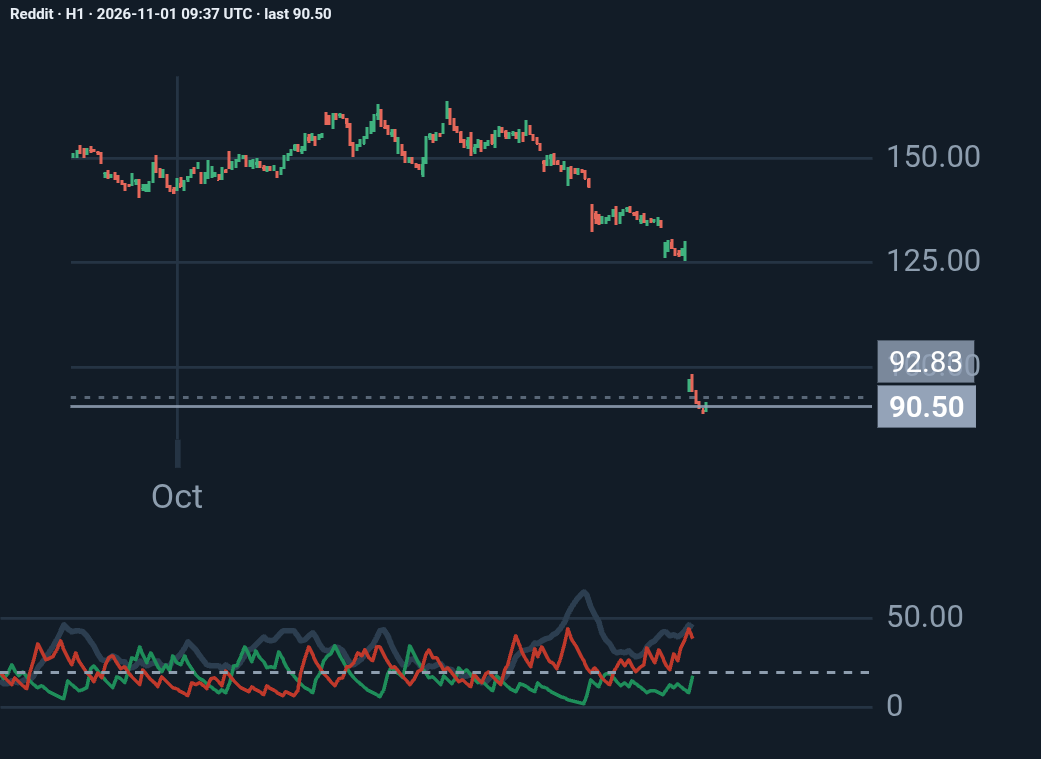
Reddit H1: my analysis
Reddit lost about 30% of its market value on October 30, 2026, the day after its third-quarter earnings, because it admitted that traffic arriving from Google search has dropped si…
Trader
1 week ago
♥ 0 💬 0
Price since published: +3.69%
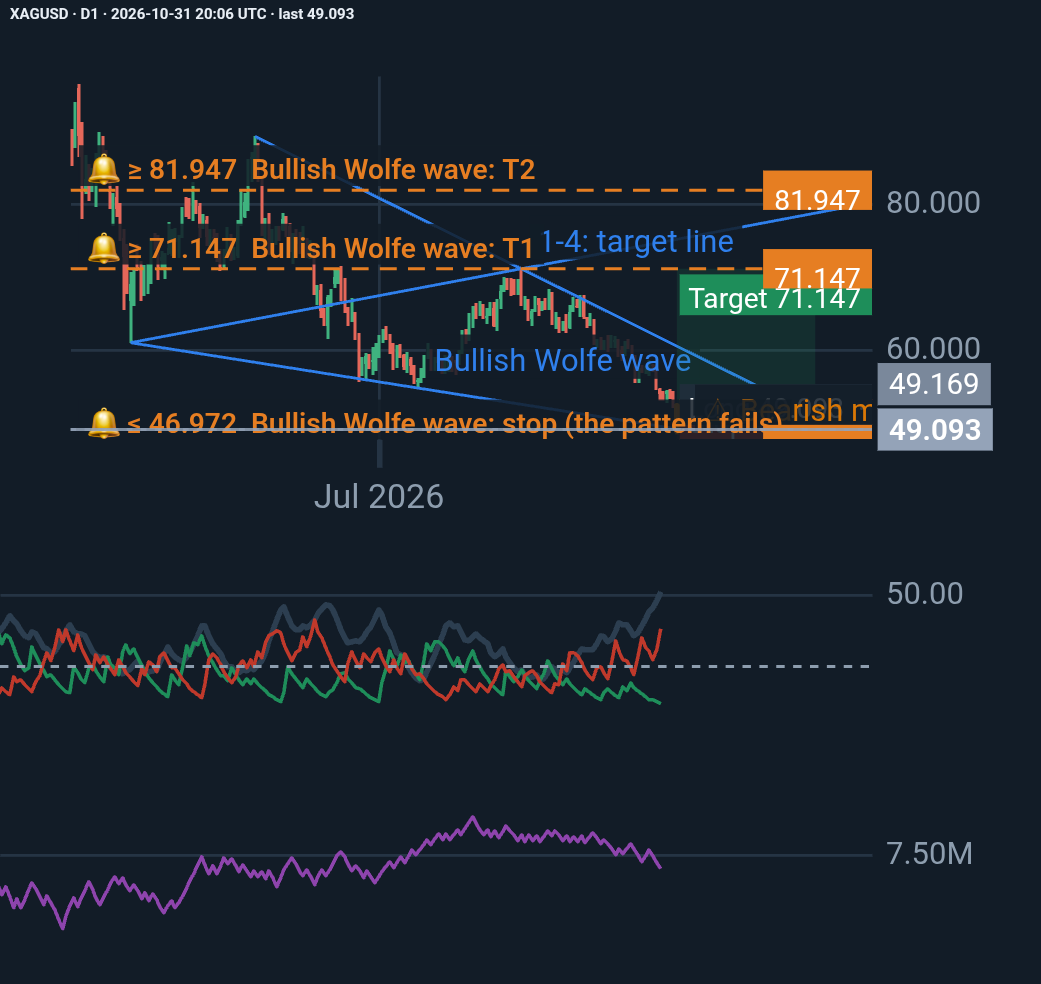
Silver (XAGUSD) – A Potential Bullish Reversal at a Critical Technical Zone
Silver has experienced a significant daily decline, with the latest session closing at 49.093, almost exactly at the projected Point 5 of a bullish Wolfe Wave pattern. Despite str…
Trader
1 week, 1 day ago
♥ 0 💬 0
Price since published: +7.06%
Ideas are the author's opinion, not investment advice. Past moves do not predict future ones.
Comments 0
Sign in or create a free account to like, follow and comment.