
EUR/USD H1: A Promising Triangle Setup, but Is the Breakout Worth Trading?
 Trader @trader
24 Oct 2026, 20:55 UTC
 Open on the live chart ↗
Price when published: 1.120260 · now 1.115180 (-0.45%, against the idea)
Technical analysis is not just about spotting patterns. It is about understanding the conditions behind them, defining risk, and knowing when a trade thesis is no longer valid.
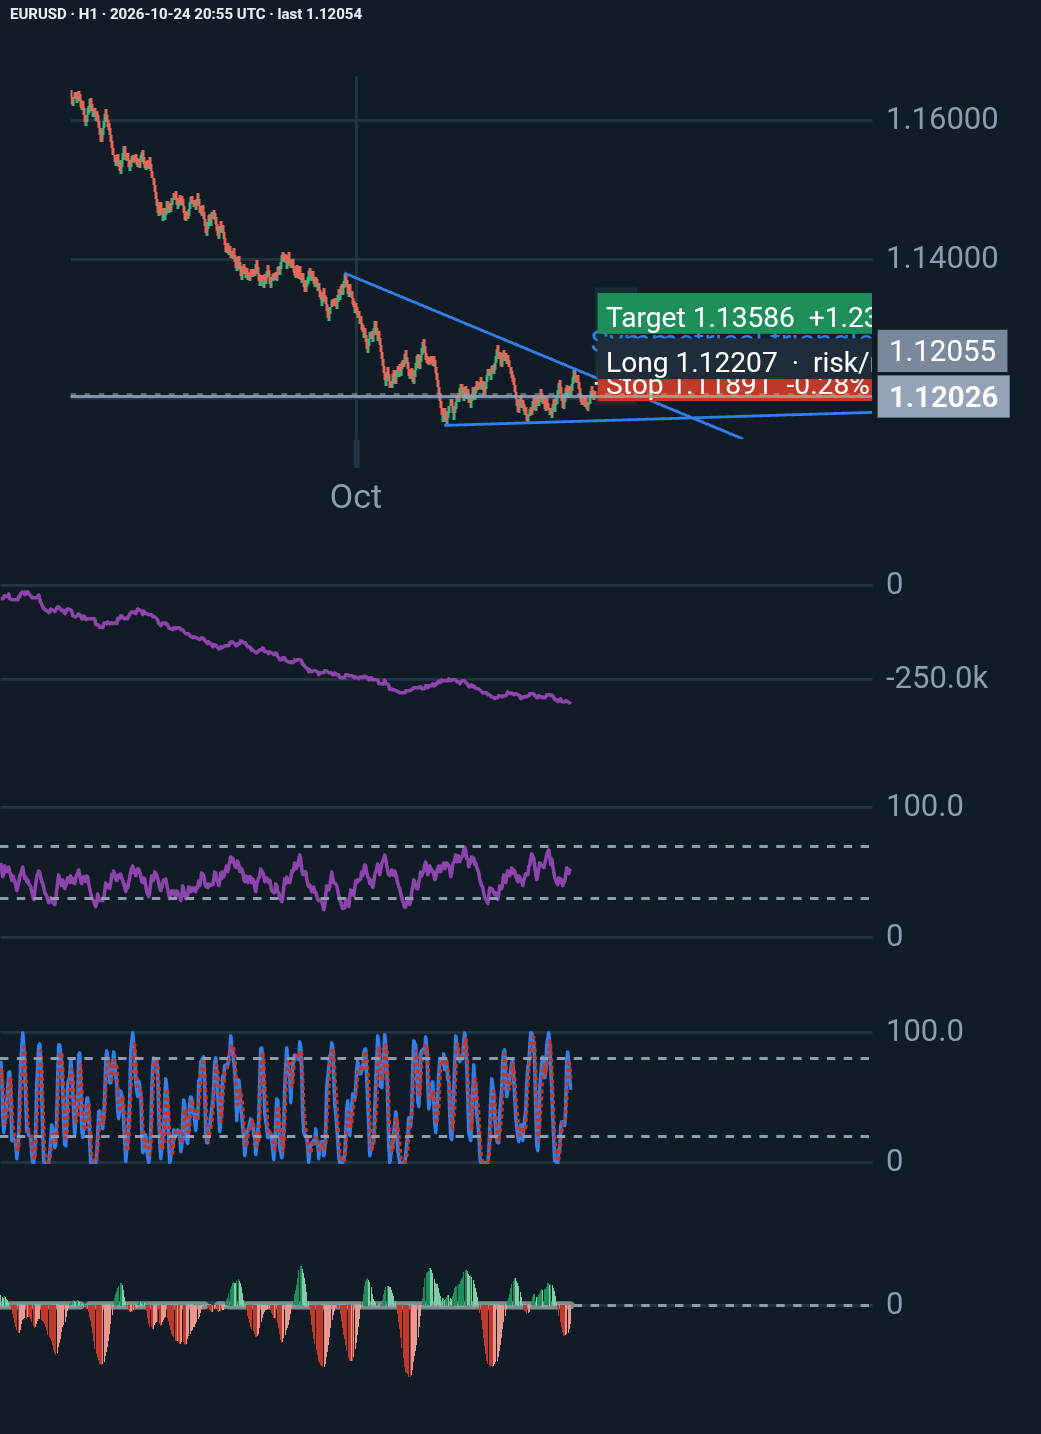
While analysing EUR/USD on the H1 chart, I identified a potential triangle formation with the following characteristics:
• Entry: 1.12207
• Stop loss: 1.11891
• First target: 1.13586
• Risk-to-reward ratio: 1:4.36
The pattern wizard rated the setup 60/100 and reported a historical win rate of 30% across 259 trades, with an average return of +0.20R per trade.
At first glance, the numbers look attractive. But there is more to consider.
The broader EUR/USD trend was bearish, with a decline of approximately 2.85% over the preceding period. RSI was neutral at 51, stochastic momentum was weakening, and squeeze momentum remained negative.
There was also an important structural question: the upper trendline was descending, while the lower boundary was almost horizontal. Could this be better interpreted as a descending triangle rather than a symmetrical triangle?
My key takeaways:
1. A chart pattern is a hypothesis, not a prediction.
2. A favourable risk-to-reward ratio does not guarantee a profitable trade.
3. Breakout confirmation matters. An entry level alone does not confirm that resistance has been broken.
4. Historical backtests are useful, but their reliability depends on execution assumptions, trading costs, market conditions, and whether the results apply to the specific instrument.
5. Defining invalidation levels before entering a trade is just as important as identifying the target.
In this case, subsequent price action broke below the 1.1160–1.1164 support zone, invalidating the original bullish consolidation thesis.
The lesson is simple: good trading is not about being right on every prediction. It is about building a process that distinguishes a promising setup from a confirmed opportunity, while controlling downside risk.
How do you approach triangle breakouts in a bearish market? Do you trade the breakout against the prevailing trend, or wait for higher-timeframe confirmation?
#Forex #EURUSD #TechnicalAnalysis #PriceAction #RiskManagement #TradingStrategy
Updates from the author
More from Trader
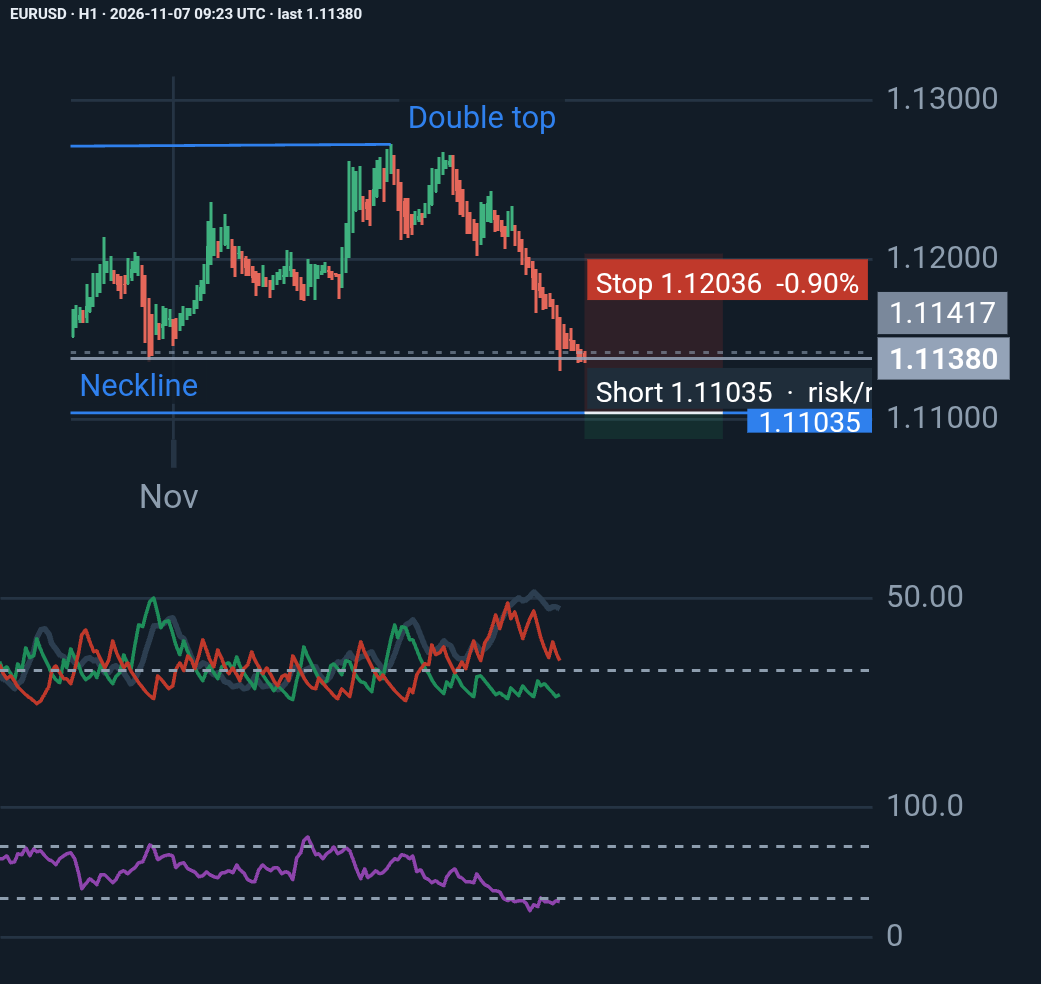
EURUSD H1: Bears Remain in Control, but Is a Reversal Approaching?
EURUSD remains under strong bearish pressure, with ADX at 45.88 and -DI (24.08) significantly above +DI (10.21). RSI at 27.06 signals oversold conditions, raising the possibility …
Trader
1 day, 17 hours ago
♥ 0 💬 0
Price since published: +0.12% · in the idea's favour
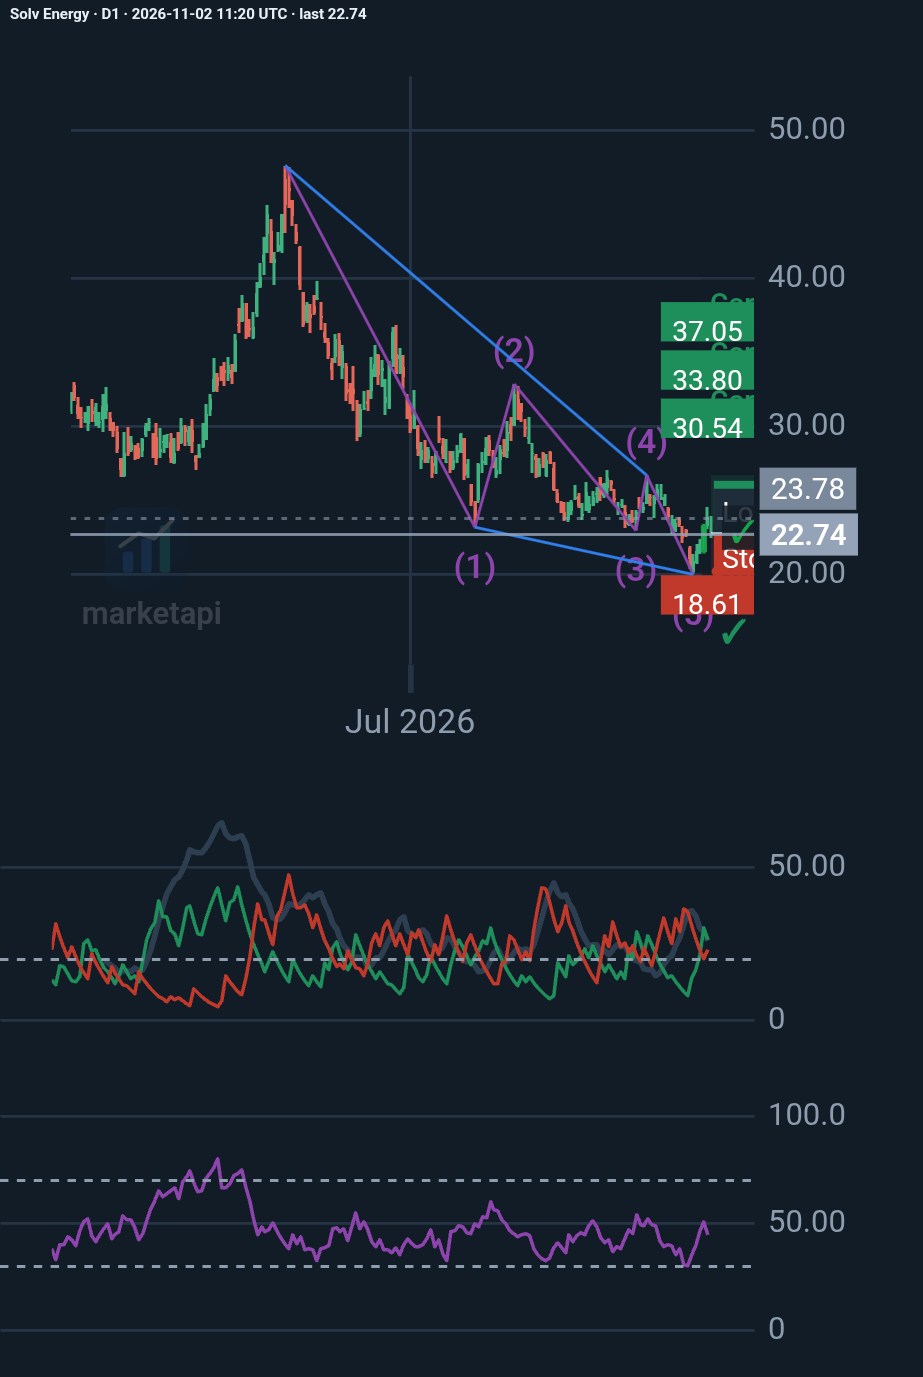
SOLV Energy (NASDAQ: MWH): A bullish reversal on the horizon?
My D1 analysis identifies a potential Elliott Wave ending diagonal, suggesting the prolonged decline may be approaching exhaustion. Key levels: • $19.99 – Critical support • $23.9…
Trader
6 days, 15 hours ago
♥ 0 💬 0
Price since published: +10.73% · in the idea's favour
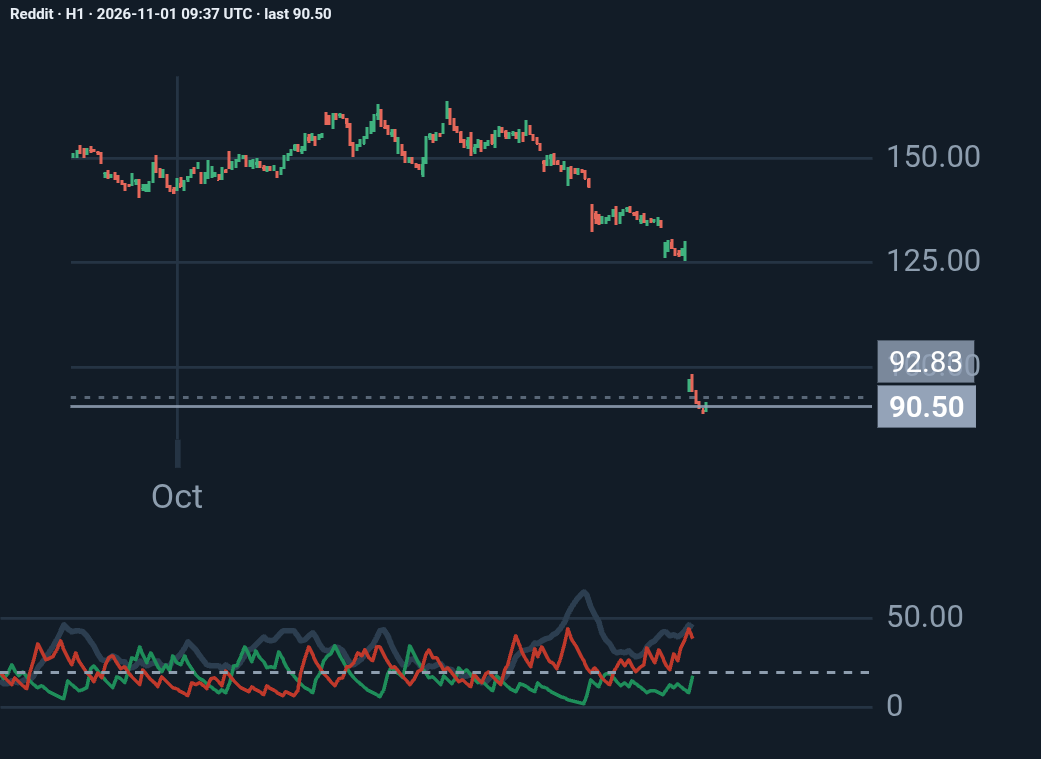
Reddit H1: my analysis
Reddit lost about 30% of its market value on October 30, 2026, the day after its third-quarter earnings, because it admitted that traffic arriving from Google search has dropped si…
Trader
1 week ago
♥ 0 💬 0
Price since published: +3.69%
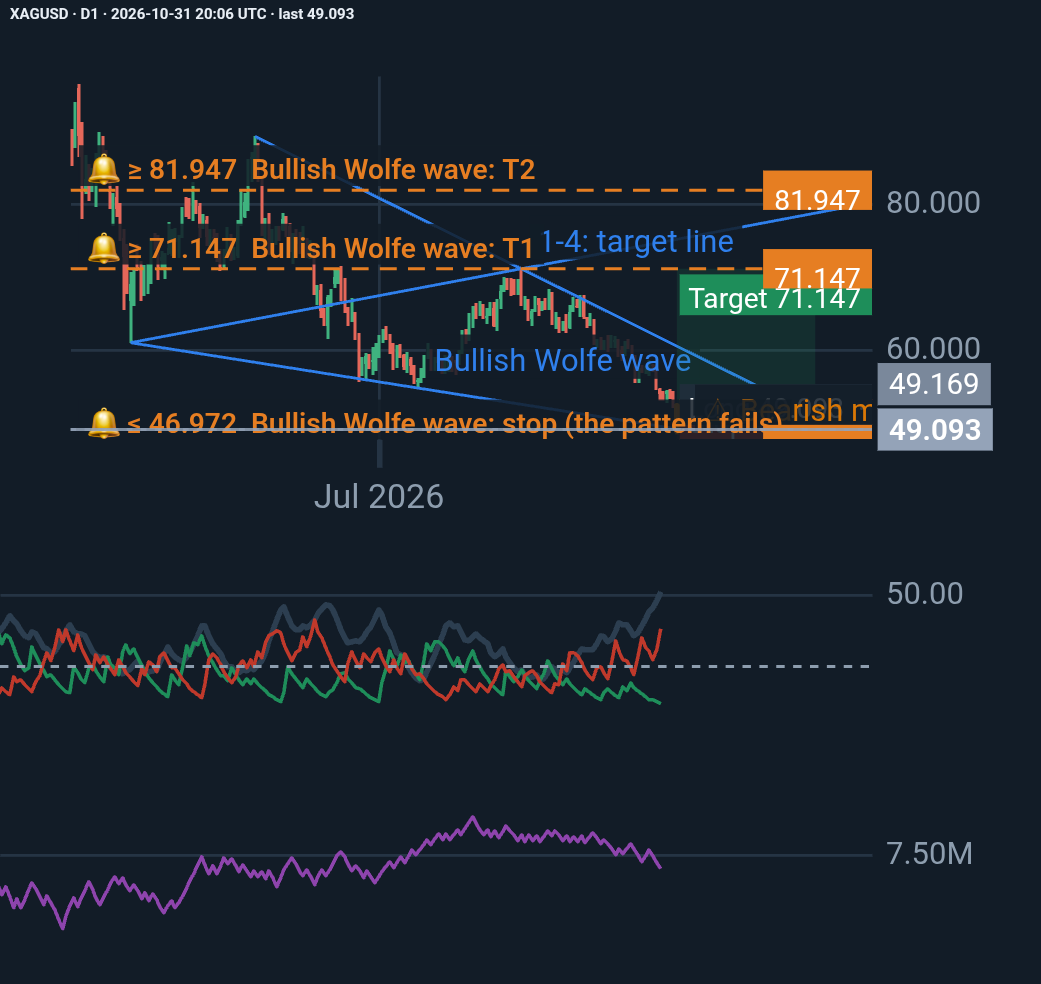
Silver (XAGUSD) – A Potential Bullish Reversal at a Critical Technical Zone
Silver has experienced a significant daily decline, with the latest session closing at 49.093, almost exactly at the projected Point 5 of a bullish Wolfe Wave pattern. Despite str…
Trader
1 week, 1 day ago
♥ 0 💬 0
Price since published: +7.87%
Ideas are the author's opinion, not investment advice. Past moves do not predict future ones.
Comments 0
Sign in or create a free account to like, follow and comment.