
Gold (XAUUSD) – Daily Technical Analysis | October 31, 2026
 Trader @trader
31 Oct 2026, 11:01 UTC
 在实时图表上打开 ↗
发布时价格:3875.730000 · 当前 4124.990000 (+6.43%,符合观点方向)
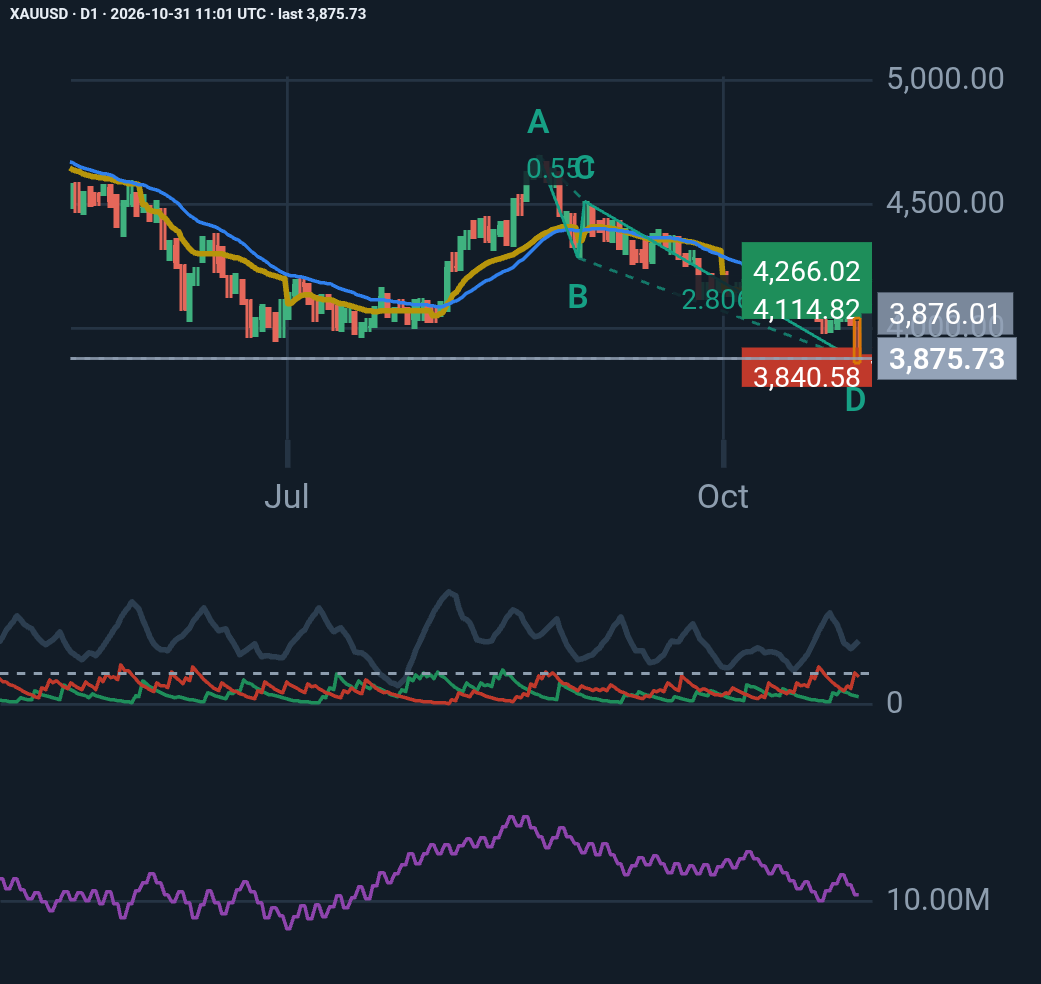
Gold is showing significant bearish momentum after a sharp decline, but an interesting bullish AB=CD harmonic pattern has emerged near the recent low of $3,870.
Here are the key observations:
1. Bearish Market Structure
- ADX(14): 41.51, indicating a strong trend.
- −DI (17.77) remains significantly above +DI (4.73).
- Price is trading below the 50-day EMA ($4,113) and VWAP ($4,099).
- The weekly trend also remains bearish.
2. Potential Bullish Reversal
A bullish AB=CD pattern with a 1.618 extension has completed around $3,870.
The projected levels are:
- Target 1: $4,114
- Target 2: $4,266
- Pattern invalidation: $3,841
The proposed long setup offers an approximate risk/reward ratio of 1:3, with an additional protective stop at $3,797.
3. The Main Warning
A bearish marubozu candle has appeared at the pattern completion area, signalling strong selling pressure.
This makes immediate bullish confirmation particularly important.
My Outlook
Gold is approaching an interesting technical decision zone.
A sustained recovery above $4,000 could strengthen the bullish reversal scenario, with $4,114 as the first major target.
However, a daily close below $3,870 would significantly weaken the harmonic setup. A break below $3,797 would invalidate the proposed long trade.
For now, I consider this a potential countertrend opportunity rather than a confirmed trend reversal.
The key question: Is $3,870 the beginning of a recovery, or merely a temporary pause in the broader downtrend?
#Gold #XAUUSD #TechnicalAnalysis #Trading #HarmonicPatterns #Forex #MarketAnalysis
作者的更新
Trader 的更多观点
EURUSD H1: Bears Remain in Control, but Is a Reversal Approaching?
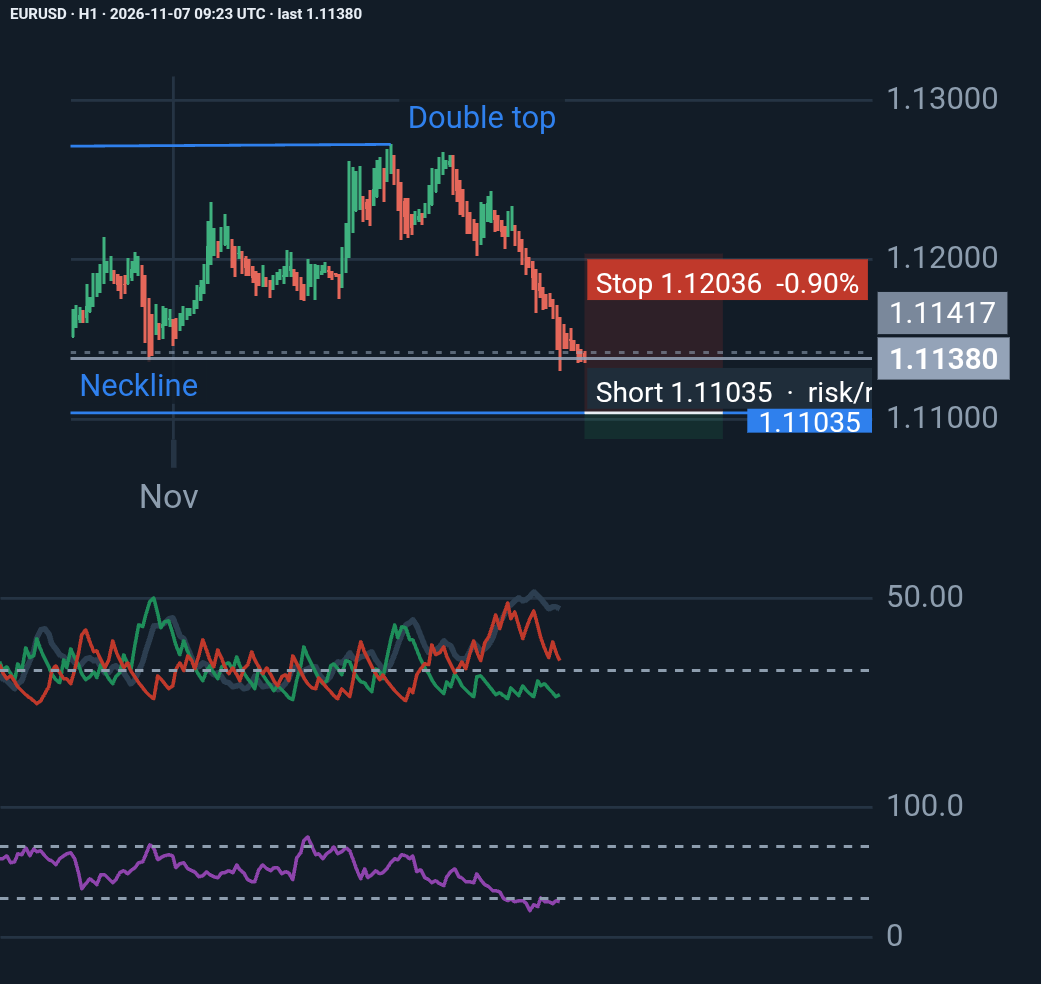
EURUSD remains under strong bearish pressure, with ADX at 45.88 and -DI (24.08) significantly above +DI (10.21). RSI at 27.06 signals oversold conditions, raising the possibility …
Trader
1 day, 17 hours前
♥ 0 💬 0
发布以来价格: +0.12% · 符合观点方向
SOLV Energy (NASDAQ: MWH): A bullish reversal on the horizon?
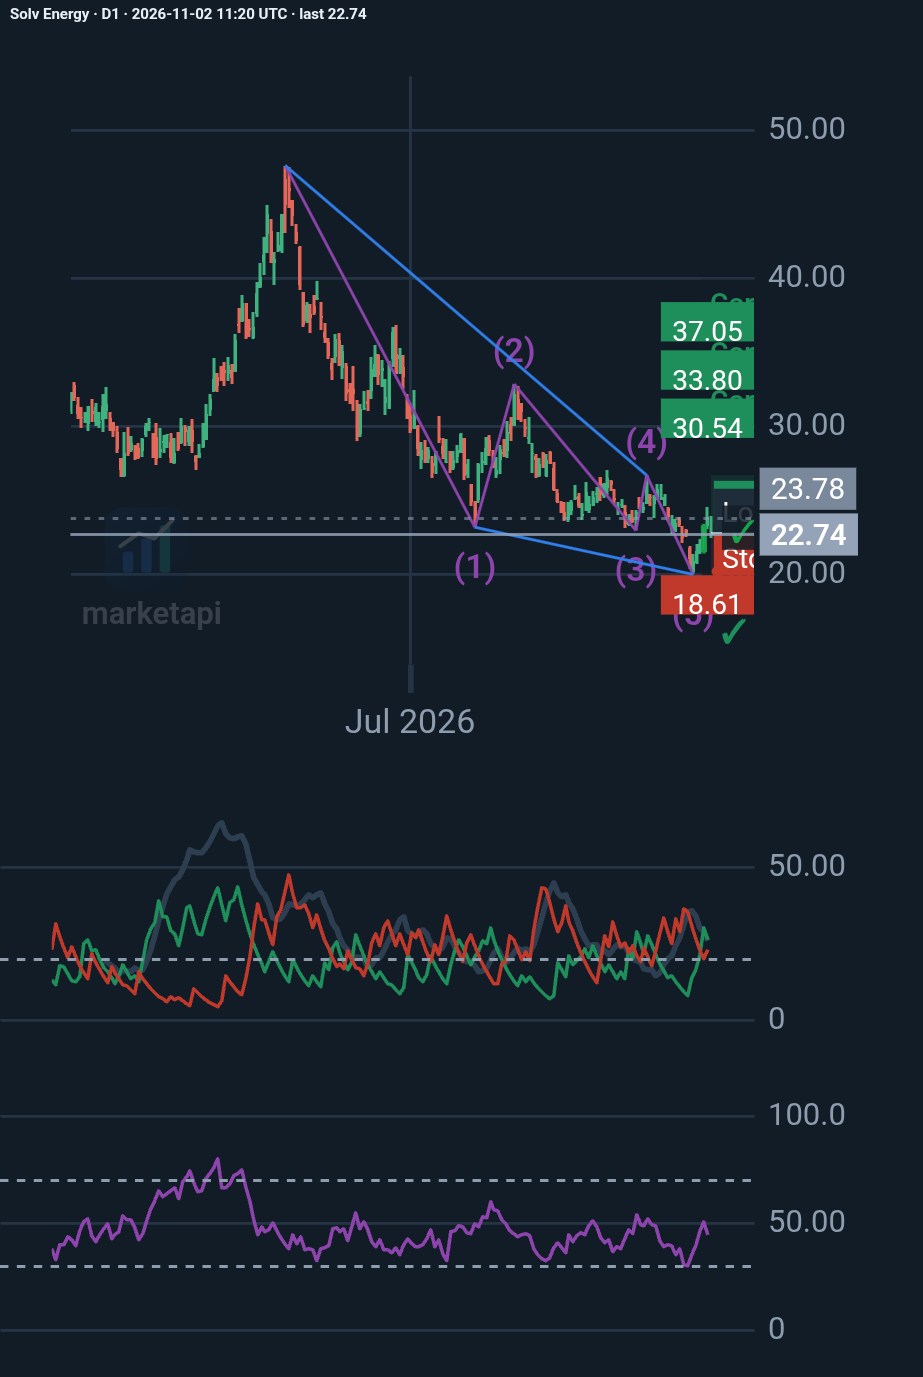
My D1 analysis identifies a potential Elliott Wave ending diagonal, suggesting the prolonged decline may be approaching exhaustion. Key levels: • $19.99 – Critical support • $23.9…
Trader
6 days, 15 hours前
♥ 0 💬 0
发布以来价格: +10.73% · 符合观点方向
Reddit H1: my analysis
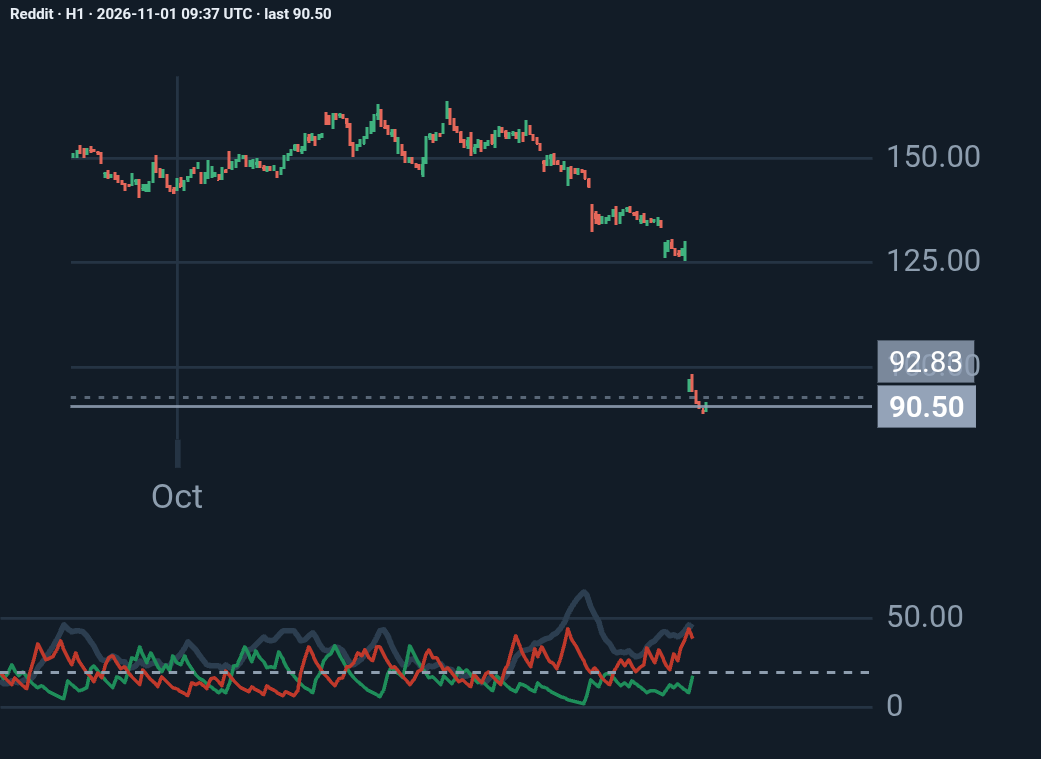
Reddit lost about 30% of its market value on October 30, 2026, the day after its third-quarter earnings, because it admitted that traffic arriving from Google search has dropped si…
Trader
1 week前
♥ 0 💬 0
发布以来价格: +3.69%
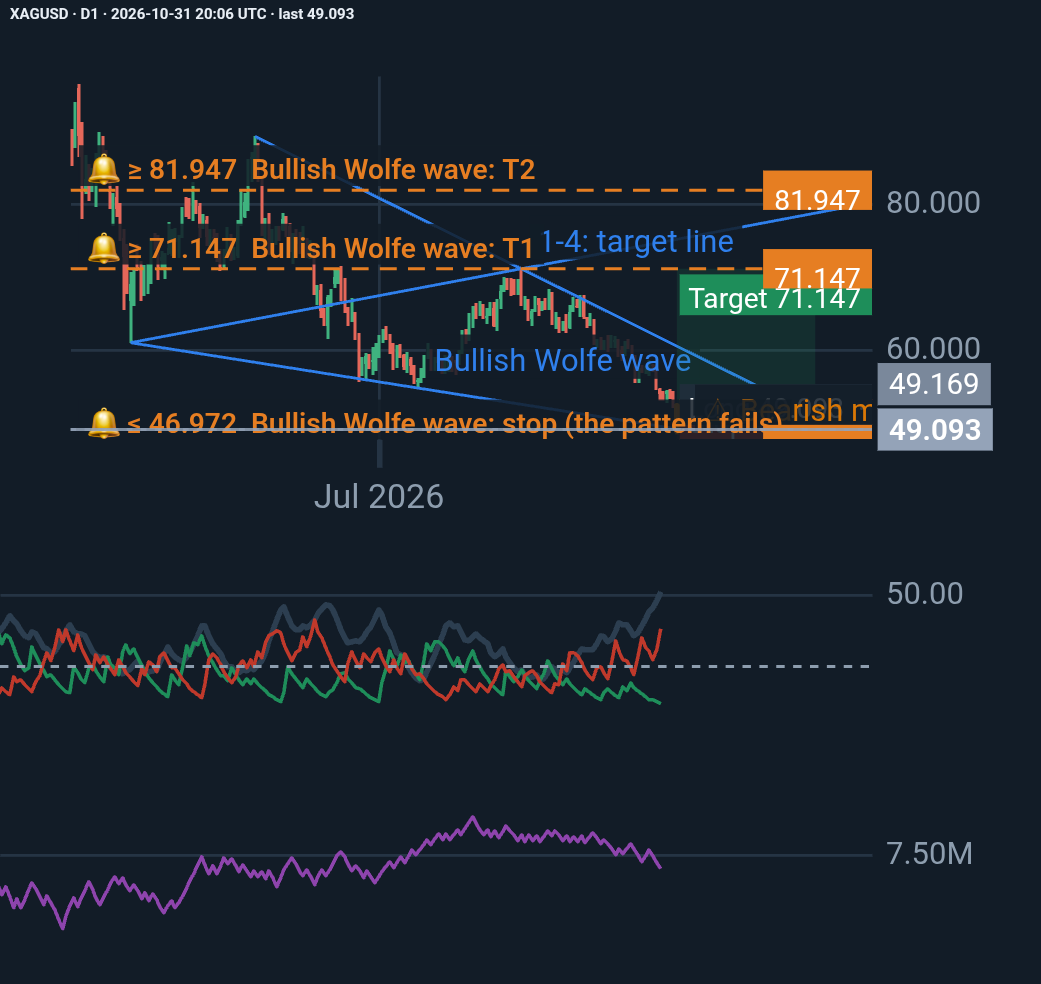
Silver (XAGUSD) – A Potential Bullish Reversal at a Critical Technical Zone
Silver has experienced a significant daily decline, with the latest session closing at 49.093, almost exactly at the projected Point 5 of a bullish Wolfe Wave pattern. Despite str…
Trader
1 week, 1 day前
♥ 0 💬 0
发布以来价格: +8.34%
观点仅代表作者意见,不构成投资建议。过往走势不预示未来走势。
评论 0
登录或创建免费账户即可点赞、关注和评论。