
Gold (XAUUSD) – Daily Technical Analysis | October 31, 2026
 Trader @trader
31 Oct 2026, 11:01 UTC
 Im Live-Chart öffnen ↗
Kurs bei Veröffentlichung: 3875.730000 · jetzt 4133.660000 (+6.66%, zugunsten der Idee)
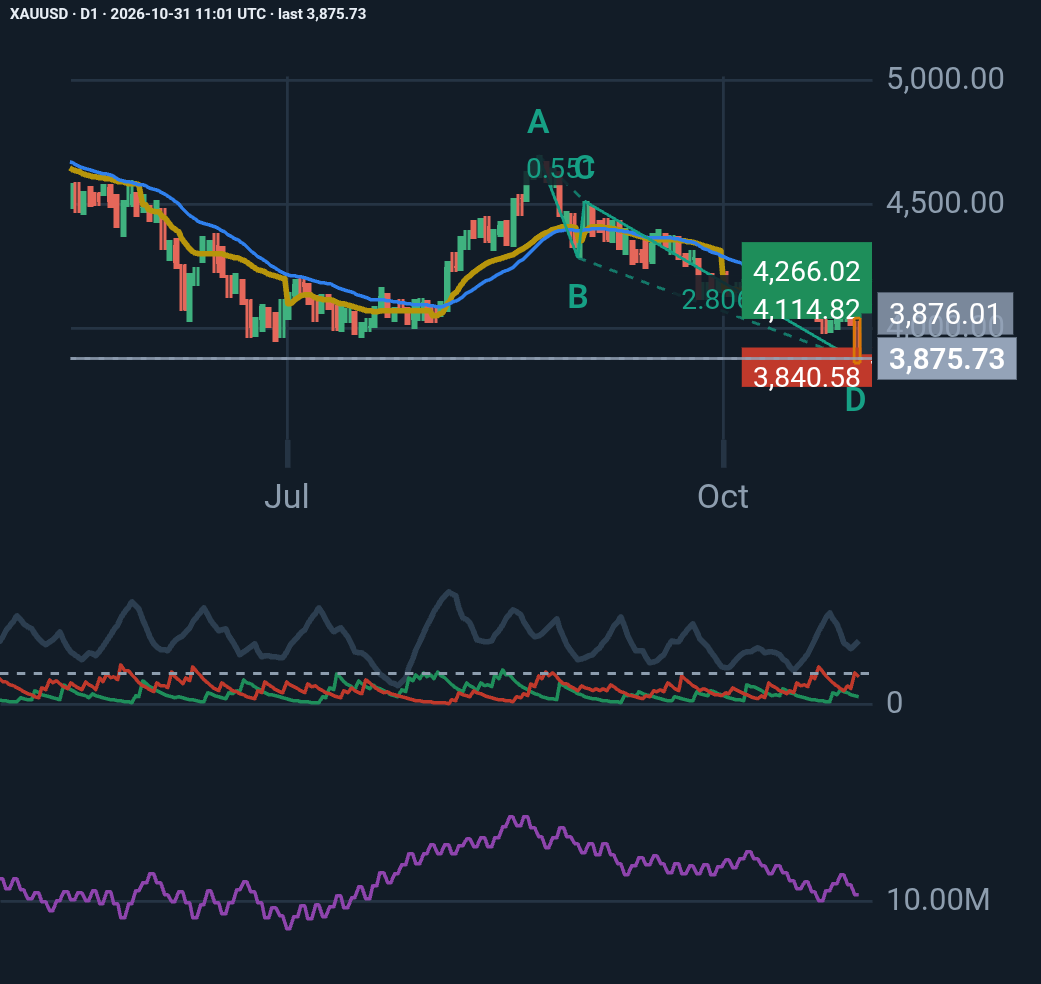
Gold is showing significant bearish momentum after a sharp decline, but an interesting bullish AB=CD harmonic pattern has emerged near the recent low of $3,870.
Here are the key observations:
1. Bearish Market Structure
- ADX(14): 41.51, indicating a strong trend.
- −DI (17.77) remains significantly above +DI (4.73).
- Price is trading below the 50-day EMA ($4,113) and VWAP ($4,099).
- The weekly trend also remains bearish.
2. Potential Bullish Reversal
A bullish AB=CD pattern with a 1.618 extension has completed around $3,870.
The projected levels are:
- Target 1: $4,114
- Target 2: $4,266
- Pattern invalidation: $3,841
The proposed long setup offers an approximate risk/reward ratio of 1:3, with an additional protective stop at $3,797.
3. The Main Warning
A bearish marubozu candle has appeared at the pattern completion area, signalling strong selling pressure.
This makes immediate bullish confirmation particularly important.
My Outlook
Gold is approaching an interesting technical decision zone.
A sustained recovery above $4,000 could strengthen the bullish reversal scenario, with $4,114 as the first major target.
However, a daily close below $3,870 would significantly weaken the harmonic setup. A break below $3,797 would invalidate the proposed long trade.
For now, I consider this a potential countertrend opportunity rather than a confirmed trend reversal.
The key question: Is $3,870 the beginning of a recovery, or merely a temporary pause in the broader downtrend?
#Gold #XAUUSD #TechnicalAnalysis #Trading #HarmonicPatterns #Forex #MarketAnalysis
Updates des Autors
Mehr von Trader
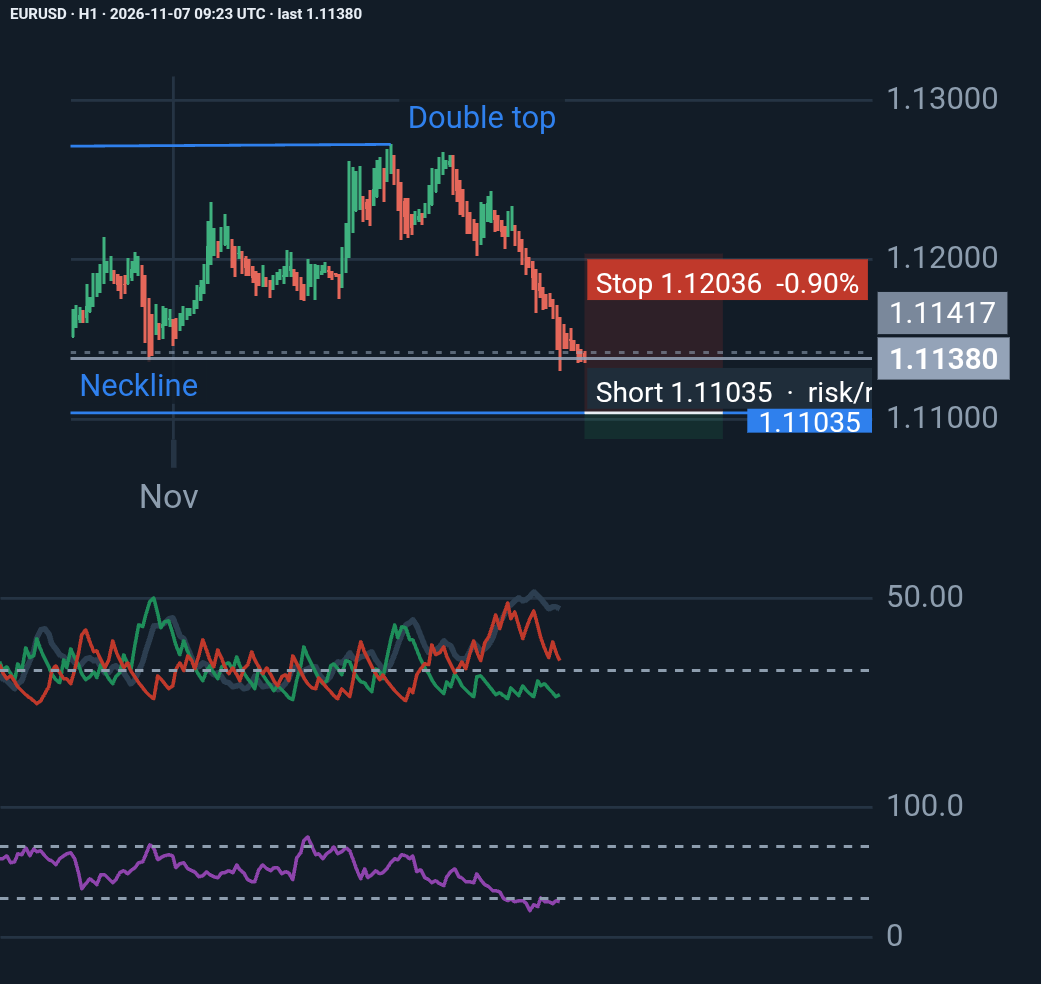
EURUSD H1: Bears Remain in Control, but Is a Reversal Approaching?
EURUSD remains under strong bearish pressure, with ADX at 45.88 and -DI (24.08) significantly above +DI (10.21). RSI at 27.06 signals oversold conditions, raising the possibility …
Trader
vor 1 day, 16 hours
♥ 0 💬 0
Kurs seit Veröffentlichung: +0.15% · zugunsten der Idee
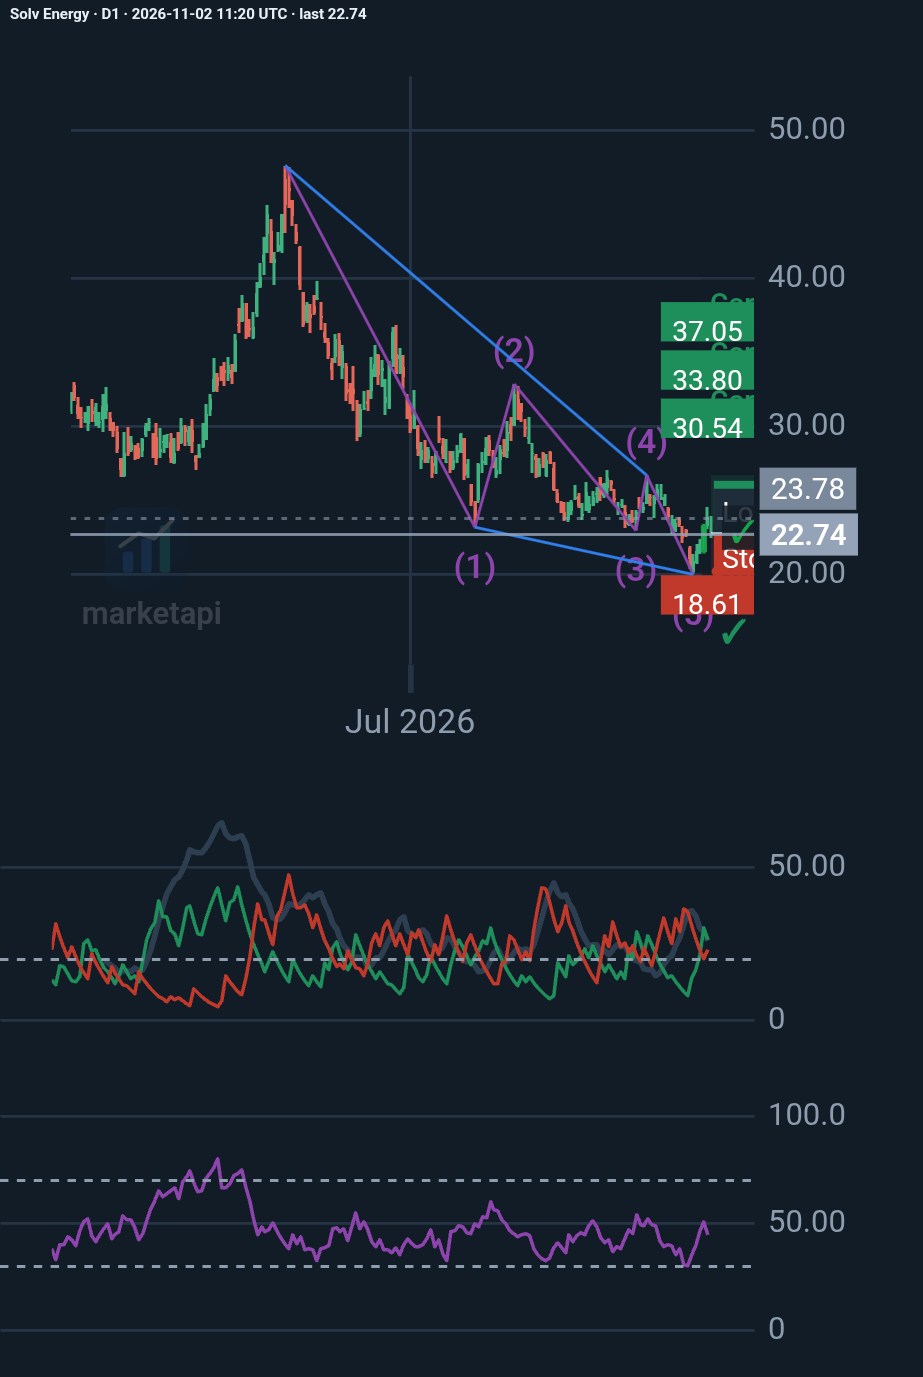
SOLV Energy (NASDAQ: MWH): A bullish reversal on the horizon?
My D1 analysis identifies a potential Elliott Wave ending diagonal, suggesting the prolonged decline may be approaching exhaustion. Key levels: • $19.99 – Critical support • $23.9…
Trader
vor 6 days, 14 hours
♥ 0 💬 0
Kurs seit Veröffentlichung: +10.73% · zugunsten der Idee
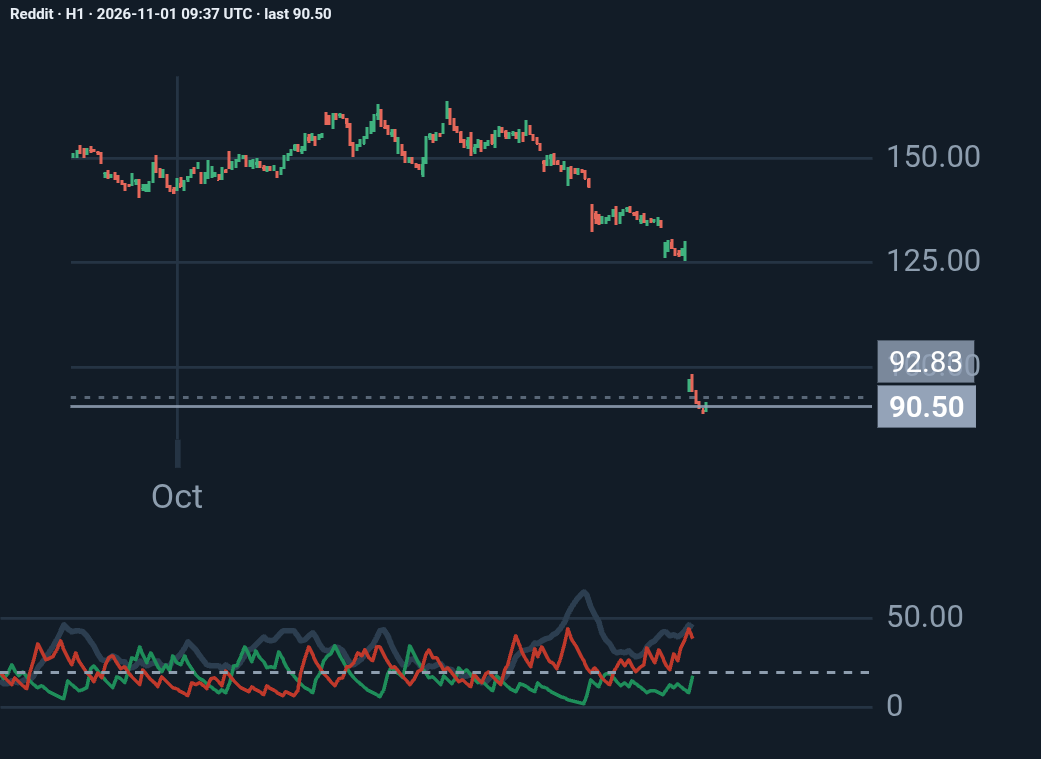
Reddit H1: my analysis
Reddit lost about 30% of its market value on October 30, 2026, the day after its third-quarter earnings, because it admitted that traffic arriving from Google search has dropped si…
Trader
vor 1 week
♥ 0 💬 0
Kurs seit Veröffentlichung: +3.69%
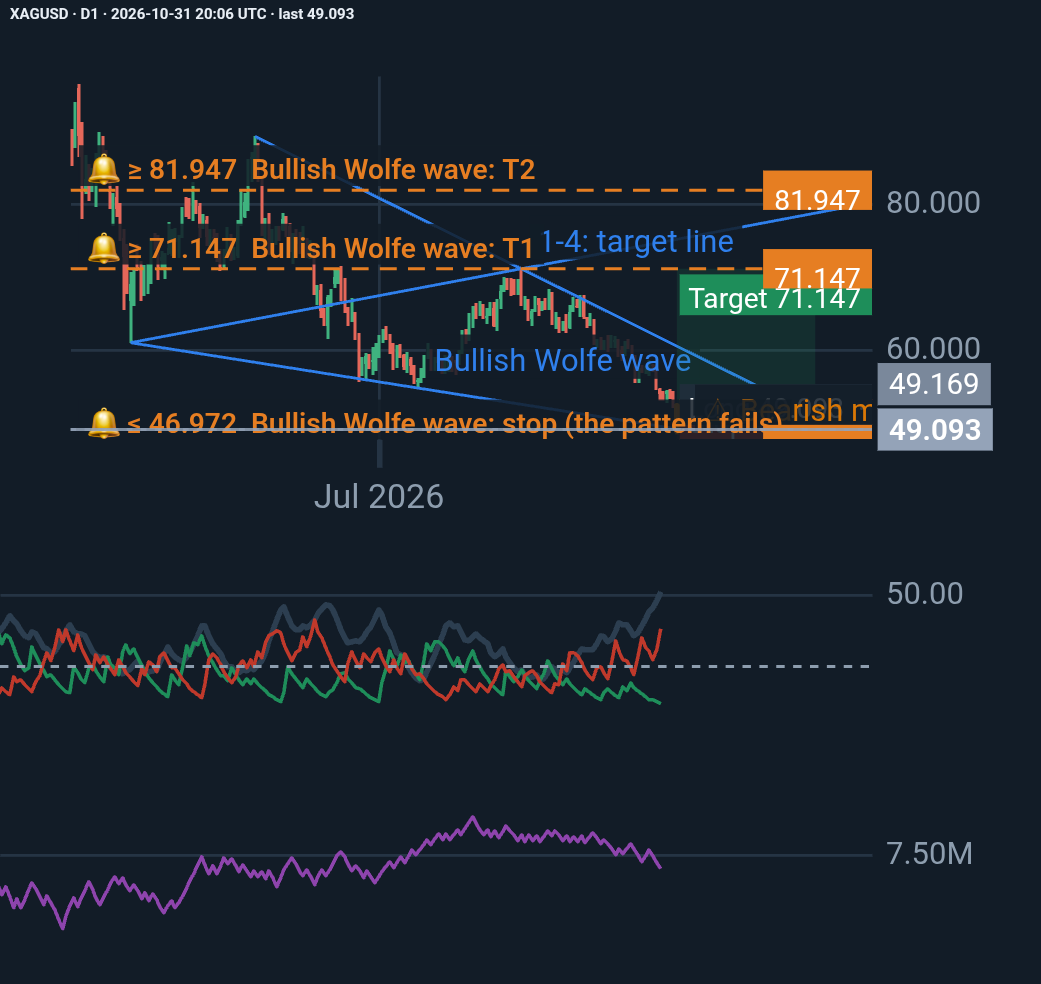
Silver (XAGUSD) – A Potential Bullish Reversal at a Critical Technical Zone
Silver has experienced a significant daily decline, with the latest session closing at 49.093, almost exactly at the projected Point 5 of a bullish Wolfe Wave pattern. Despite str…
Trader
vor 1 week, 1 day
♥ 0 💬 0
Kurs seit Veröffentlichung: +8.82%
Ideen sind die Meinung des Autors, keine Anlageberatung. Vergangene Bewegungen sagen künftige nicht voraus.
Kommentare 0
Melden Sie sich an oder erstellen Sie ein kostenloses Konto, um zu liken, zu folgen und zu kommentieren.