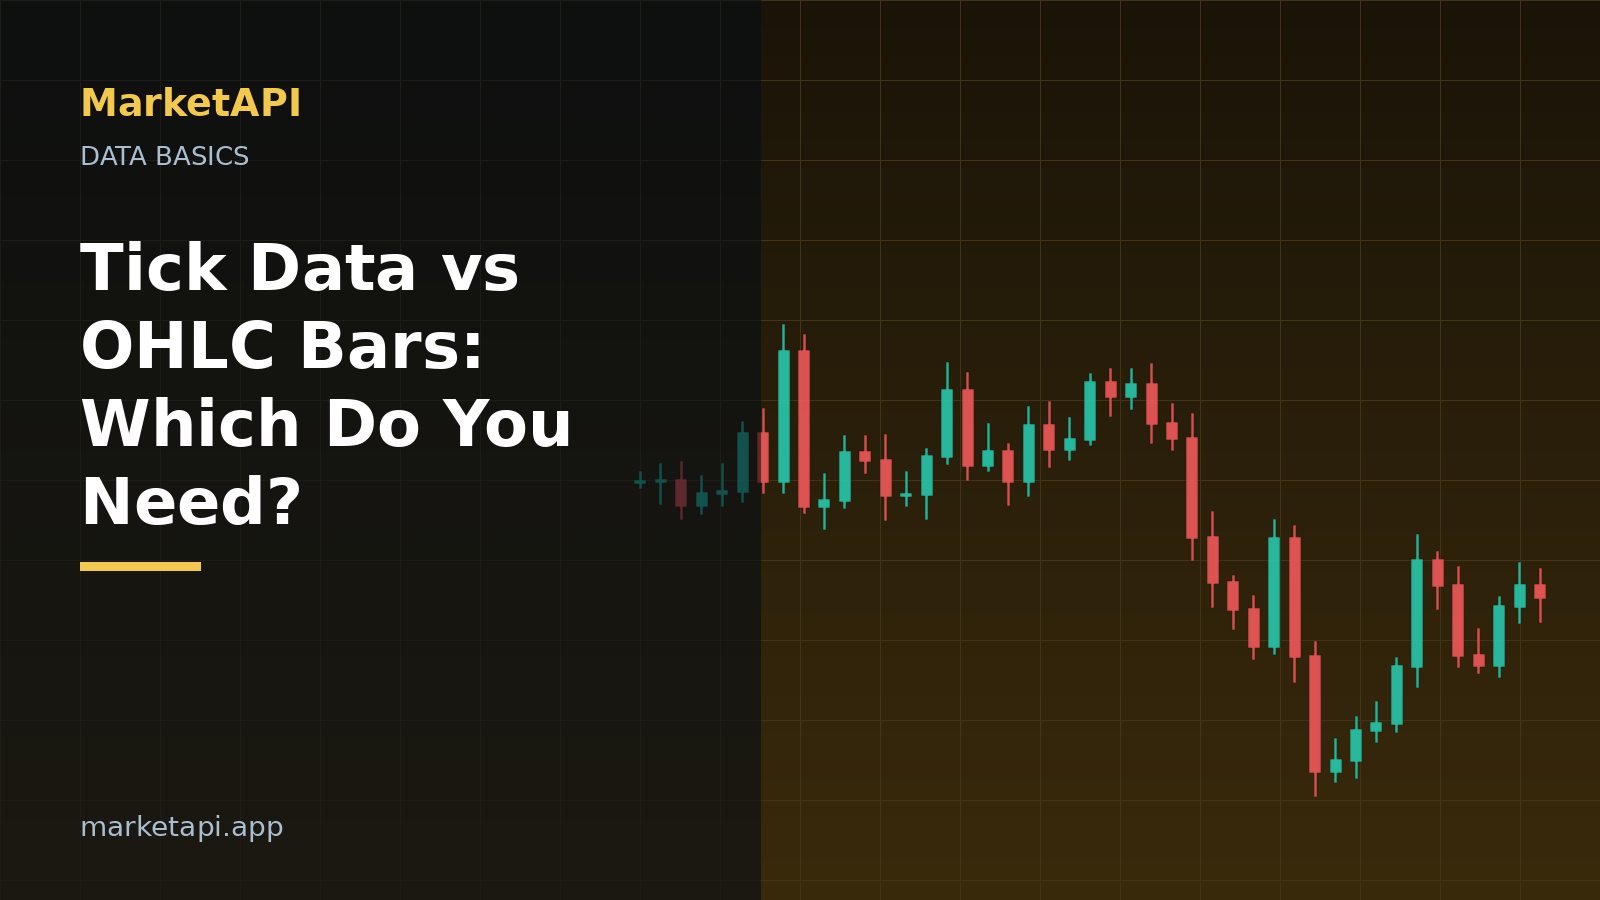
Historical market data comes in two main shapes. Tick data records every price change with its exact time. OHLC bars (candles) compress a period into open, high, low and close. Choosing the right one saves storage, money and time.
Tick data
- Maximum precision: exact bid/ask sequence, spreads and timing.
- Essential for scalping and execution research, slippage studies and spread analysis.
- Large: a busy forex pair produces many thousands of ticks per day.
curl -H "Authorization: Bearer $API_KEY" "https://api.marketapi.app/v1/ticks?symbol=EURUSD&from=2026-09-01T10:00:00Z&to=2026-09-01T11:00:00Z"OHLC bars
- Compact: one row per period, from one minute to one month.
- Enough for most charting, indicators and swing strategies.
- Cannot tell you what happened inside the bar (which came first, high or low).
How to choose
| Use case | Best data |
|---|---|
| Charts and dashboards | OHLC (M5 to D1) |
| Swing and position strategies | OHLC (H1 to D1) |
| Scalping, spread and slippage research | Ticks |
| Machine-learning features | OHLC, ticks for microstructure |
Storage and cost
A year of daily candles for one symbol is a few hundred rows; a year of minute candles is hundreds of thousands; a year of ticks for a busy pair can reach tens of millions of rows. Plan storage and API usage accordingly: download ticks only for the periods your research really needs, and keep them compressed.
What ticks reveal that candles hide
- The real spread at every moment, including widening around news and rollover.
- The order of moves inside a minute: did price hit your stop or your target first?
- Bursts of activity that a candle's tick volume only summarises.
Can I build candles from ticks myself?
Yes, by grouping ticks into periods, but use the API's candles when you can: they follow the documented trading-day convention and save processing time.
A practical approach: research with candles, then validate the final strategy on ticks for the periods that matter. See the OHLC guide and the docs.