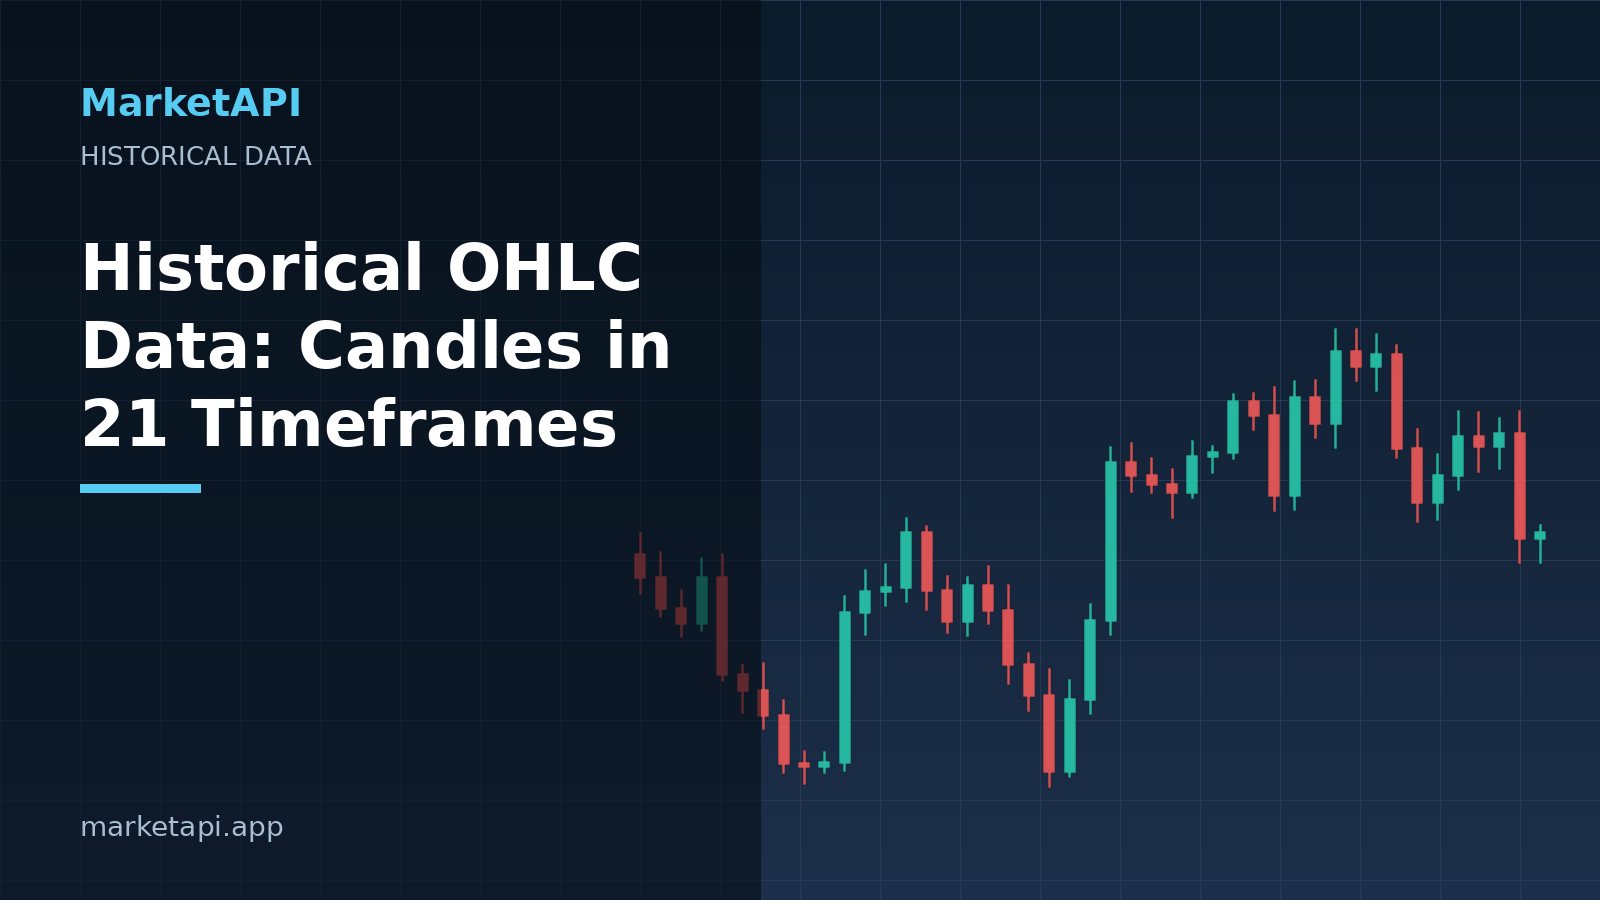
OHLC data (open, high, low, close) summarises price action over a fixed period. A historical OHLC data API returns these candles for any symbol and timeframe, the raw material for charts, backtests, indicators and machine-learning features.
Anatomy of a candle
- Open: first price of the period. Close: last price.
- High and low: the extremes within the period.
- Tick volume: number of price changes, a useful activity proxy for forex.
- Complete: whether the period has finished or is still forming.
21 timeframes
MarketAPI serves every standard timeframe: M1 to M30, H1 to H12, D1, W1 and MN1. Higher timeframes are built from one-minute data in the broker's trading-day convention, so daily candles close at 17:00 New York time, like in trading platforms.
Downloading candles
curl -H "Authorization: Bearer $API_KEY" "https://api.marketapi.app/v1/bars?symbol=EURUSD&timeframe=M15&from=2026-09-01T00:00:00Z&to=2026-09-02T00:00:00Z&limit=1000"Times are UTC (ISO 8601 or epoch milliseconds). If the response contains next_cursor, repeat the call with &cursor=… to fetch the next page.
Best practices
- Cache history: completed candles never change; store them and fetch only new ones.
- Pick the coarsest timeframe you need: daily data for years of charts, minutes only where precision matters.
- Respect time zones: compare candles in UTC; read our time-zone guide.
- Check
completebefore using the last candle in calculations.
OHLC or ticks?
Candles are compact and enough for most analysis; ticks capture every change. Compare both in tick data vs OHLC bars.
Building indicators from candles
Moving averages, RSI, ATR and Bollinger Bands are all computed from OHLC series. Always calculate them on complete candles; including the forming candle makes values change until the period closes and creates false signals in backtests.
Backtesting pitfalls
- Look-ahead bias: never use a candle's close to make a decision earlier in the same candle.
- Survivorship: test on the instruments that existed at the time, not only today's list.
- Spread costs: candles show one price; add realistic spreads, or validate on tick data.
- Gaps: weekends and holidays create missing periods, which is normal, not an error.
How much history is available?
It depends on the symbol and timeframe: daily data usually covers many years, minute data the more recent period. The API returns what exists and tells you when there is more.
See all parameters in the API documentation.