
XAUUSD D1 analysis
 Trader @trader
27 Oct 2026, 16:02 UTC
 Открыть на живом графике ↗
Цена при публикации: 4061.850000 · сейчас 4094.670000 (+0.81%, в пользу идеи)
Gold (XAUUSD) | Daily Technical Analysis | October 26, 2026
Is gold preparing for a corrective rebound after a strong bearish move?
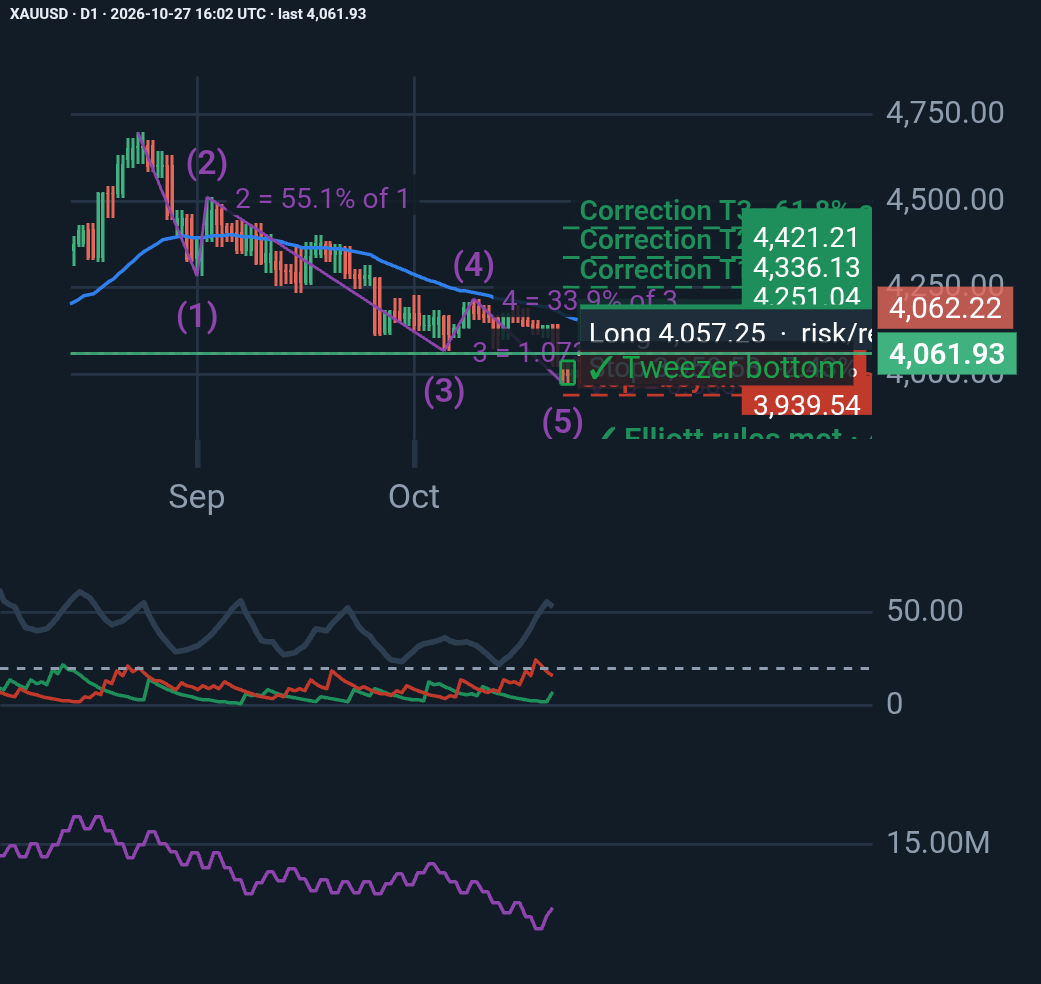
On the daily chart, XAUUSD has declined from 4,696.66 to 3,975.59, forming a potential five-wave bearish Elliott impulse. Recent price action, however, is showing early signs of a possible reversal.
Here are the key technical observations:
📉 Elliott Wave Structure
The five-wave decline appears structurally valid, suggesting the bearish impulse may be approaching completion. However, a valid wave count does not guarantee that the low is final.
🕯️ Potential Tweezer Bottom
The recent price action around 3,975–3,989 suggests a possible support zone. The latest daily candle closed at 4,064.29, near its high, indicating a strong recovery during the session.
📊 Key Resistance Levels
If the rebound continues, these are the levels I will be watching:
• 4,158 — 50-day EMA
• 4,217 — Previous Wave 4 high
• 4,251 — 38.2% Fibonacci retracement
• 4,336 — 50% retracement
• 4,421 — 61.8% retracement
⚠️ What Could Invalidate the Bullish Scenario?
A decisive break below 3,975.59 would weaken the potential bottoming pattern. A move below 3,939.54 would invalidate my current interpretation of the completed five-wave decline.
📈 Momentum Still Matters
The ADX is elevated at 53.22, while −DI (16.02) remains above +DI (7.72). This suggests that bearish directional momentum still dominates, despite the latest recovery.
My view: Gold may be setting up for a corrective rally, but confirmation is still needed. The 4,158 EMA and 4,217 resistance will be important tests for buyers.
The key is to distinguish a temporary bounce from a genuine trend reversal and manage risk accordingly.
What is your view on XAUUSD? Are we approaching the end of the correction, or could gold make another low before recovering?
#XAUUSD #Gold #TechnicalAnalysis #ElliottWave #ForexTrading #PriceAction #TradingStrategy #RiskManagement
Обновления от автора
Ещё от Trader
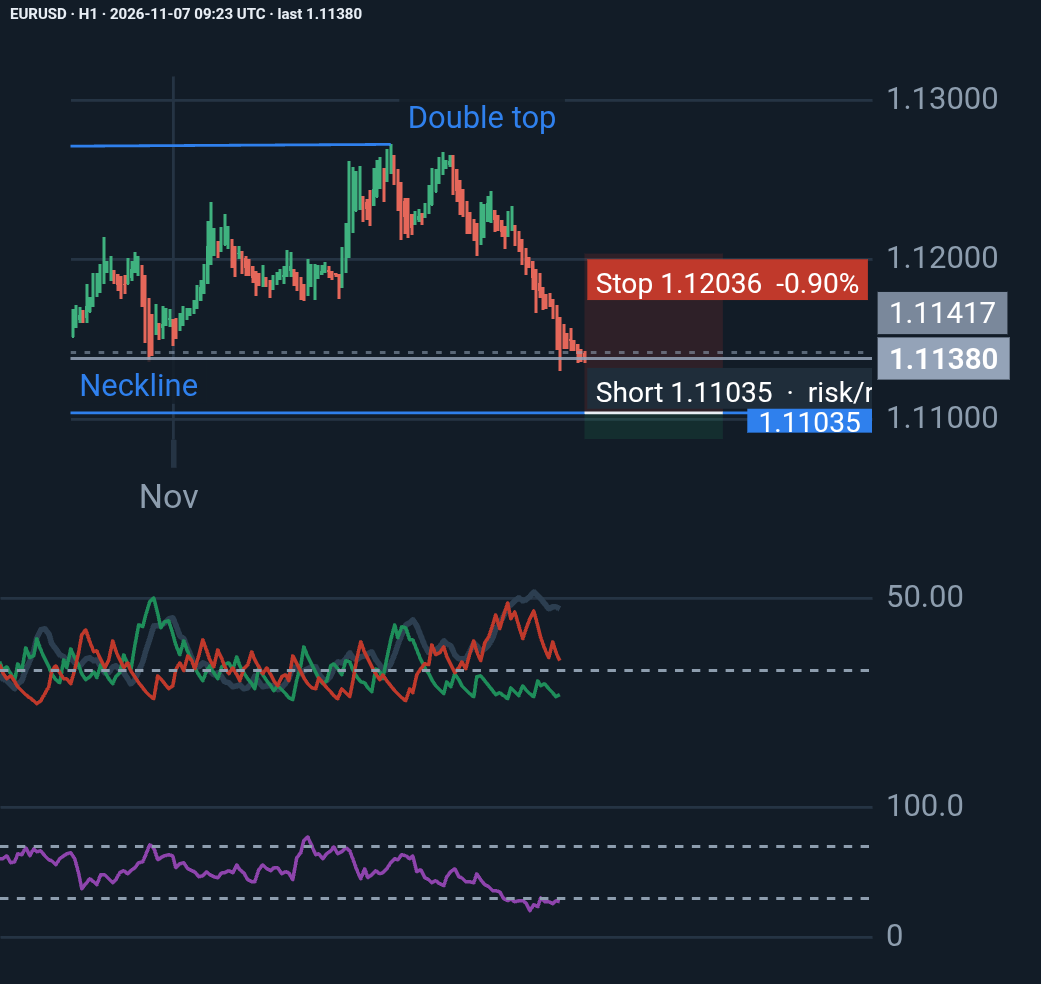
EURUSD H1: Bears Remain in Control, but Is a Reversal Approaching?
EURUSD remains under strong bearish pressure, with ADX at 45.88 and -DI (24.08) significantly above +DI (10.21). RSI at 27.06 signals oversold conditions, raising the possibility …
Trader
1 day, 15 hours назад
♥ 0 💬 0
Цена с момента публикации: +0.10% · в пользу идеи
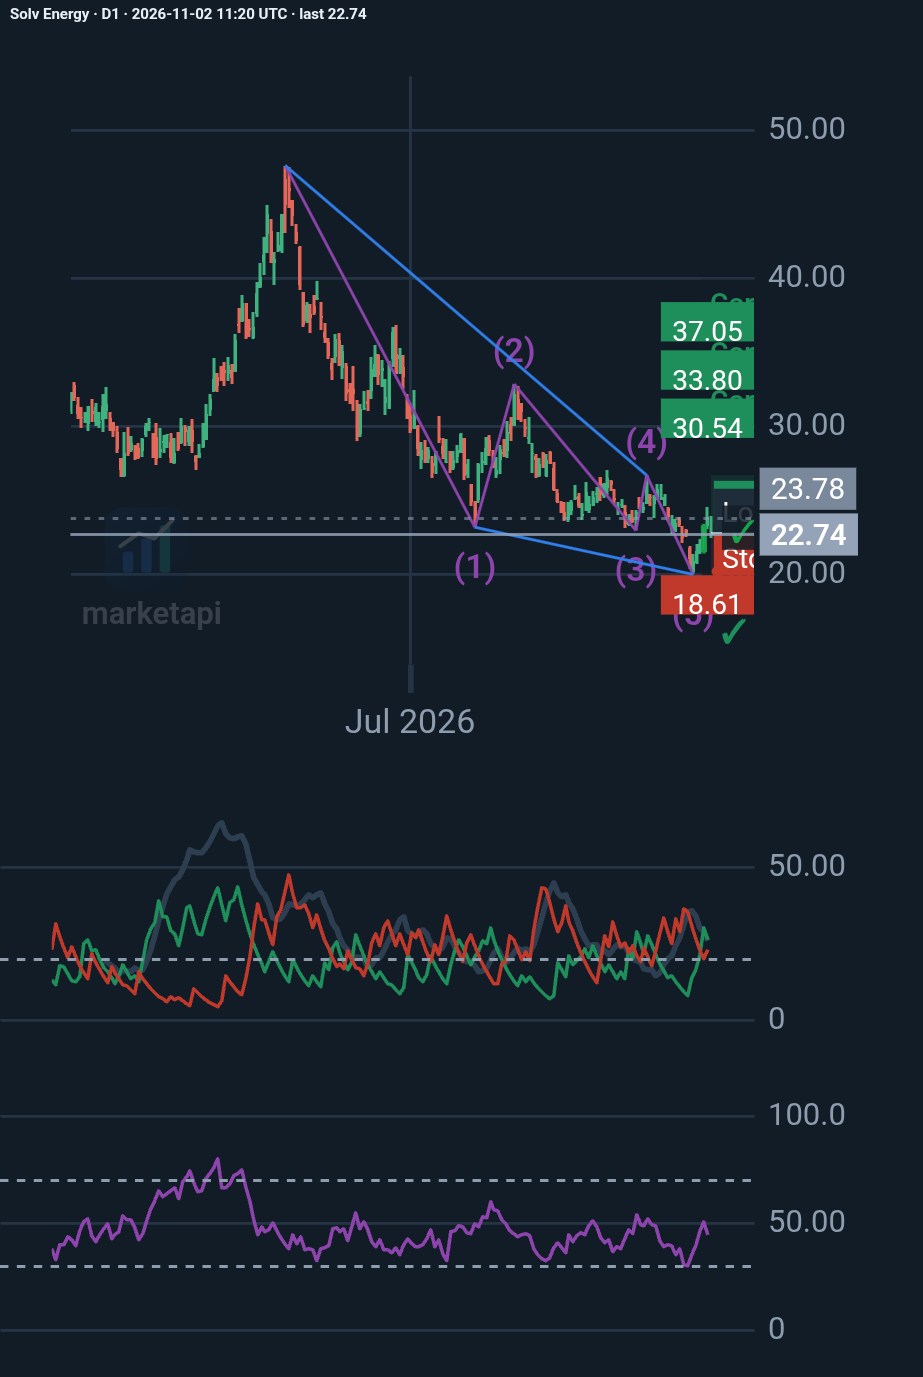
SOLV Energy (NASDAQ: MWH): A bullish reversal on the horizon?
My D1 analysis identifies a potential Elliott Wave ending diagonal, suggesting the prolonged decline may be approaching exhaustion. Key levels: • $19.99 – Critical support • $23.9…
Trader
6 days, 13 hours назад
♥ 0 💬 0
Цена с момента публикации: +10.73% · в пользу идеи
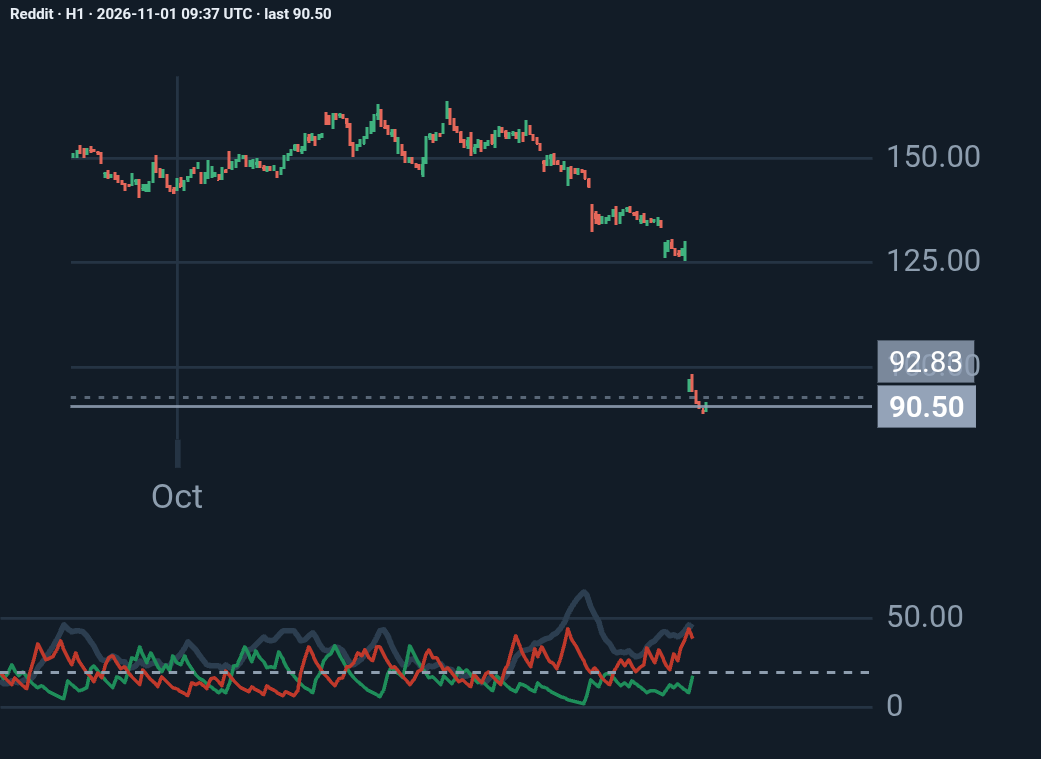
Reddit H1: my analysis
Reddit lost about 30% of its market value on October 30, 2026, the day after its third-quarter earnings, because it admitted that traffic arriving from Google search has dropped si…
Trader
1 week назад
♥ 0 💬 0
Цена с момента публикации: +3.69%
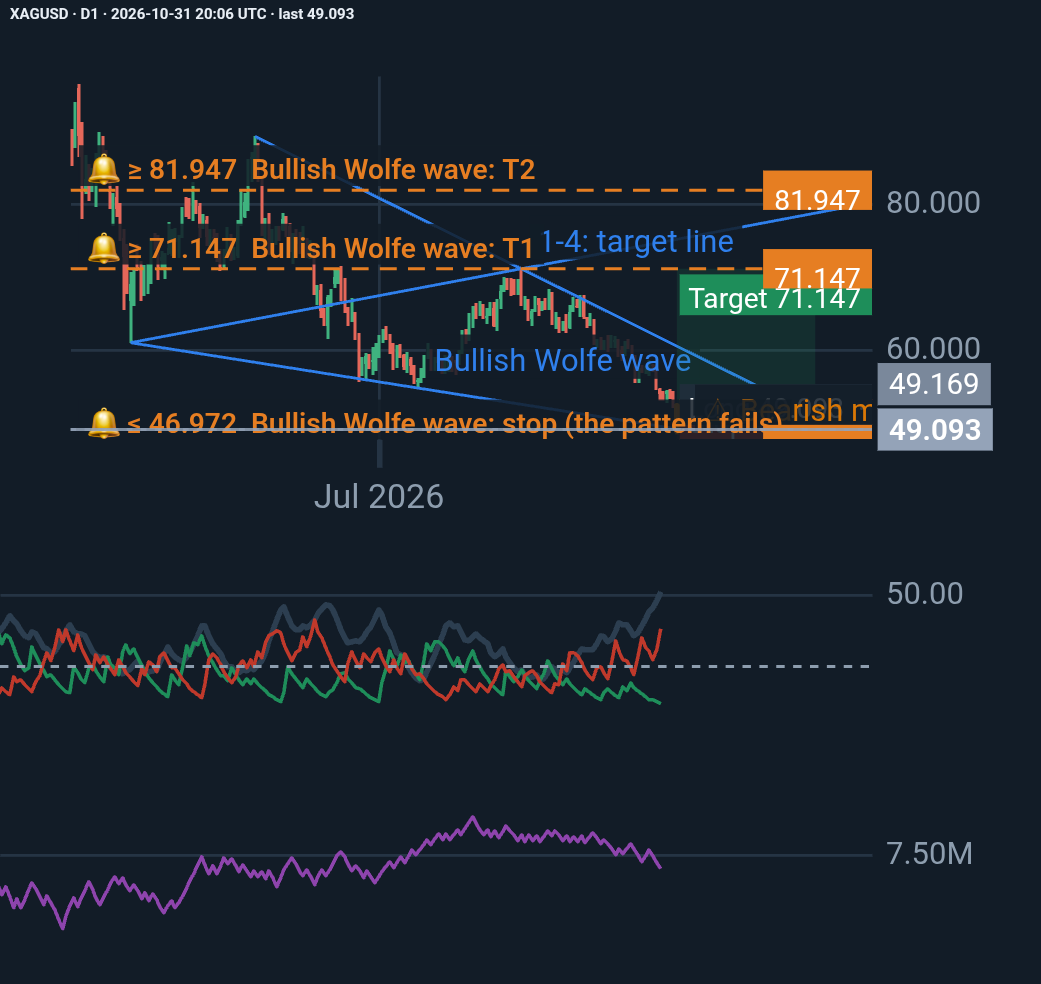
Silver (XAGUSD) – A Potential Bullish Reversal at a Critical Technical Zone
Silver has experienced a significant daily decline, with the latest session closing at 49.093, almost exactly at the projected Point 5 of a bullish Wolfe Wave pattern. Despite str…
Trader
1 week, 1 day назад
♥ 0 💬 0
Цена с момента публикации: +6.87%
Идеи — мнение автора, а не инвестиционная рекомендация. Прошлые движения не предсказывают будущие.
Комментарии 0
Войдите или создайте бесплатный аккаунт, чтобы ставить лайки, подписываться и комментировать.