
USD/JPY H4 Analysis: A Bullish Reversal or Just a Temporary Recovery?
 Trader @trader
26 Oct 2026, 19:54 UTC
 افتح على الرسم البياني المباشر ↗
السعر عند النشر: 157.452000 · الآن 158.291000 (+0.53%، لصالح الفكرة)
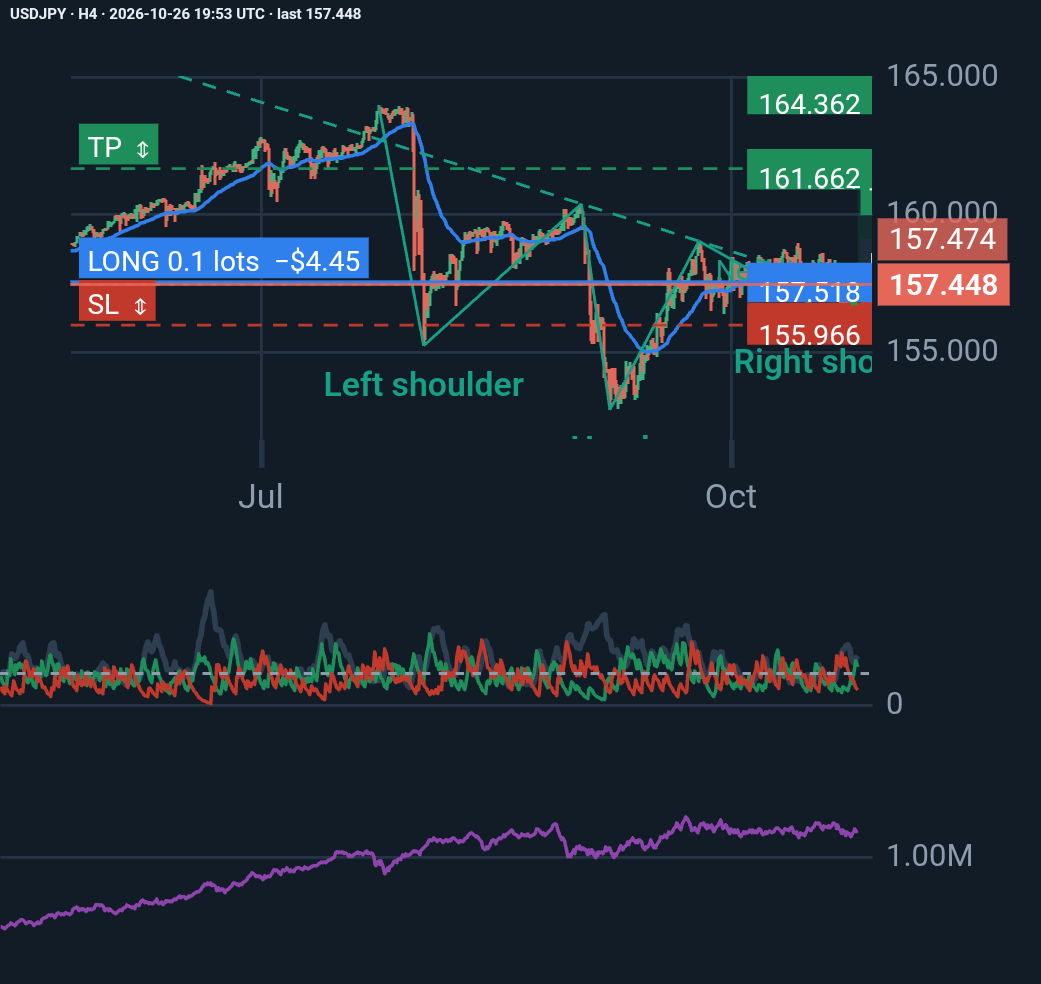
USD/JPY is showing signs of short-term bullish momentum, but the bigger picture still calls for caution.
Here are the key observations from my latest technical analysis:
📈 1. Inverse Head and Shoulders
The chart shows a potential inverse head-and-shoulders pattern, suggesting a possible bullish reversal. However, price is still below the key neckline, so confirmation remains important.
📊 2. Momentum Indicators
• ADX: 31.18, indicating a strong trend.
• +DI: 24.44 vs. -DI: 9.74, showing that buyers currently have the directional advantage.
• EMA 50: Around 157.600, acting as an important near-term resistance level.
🎯 3. Key Price Levels
• Resistance: 157.600, followed by 157.850–158.000.
• Major neckline resistance: 159.024–160.381.
• Support: 156.570–156.066.
• A break below 155.966 would invalidate my proposed long trade setup.
🚀 Bullish Scenario:
A sustained H4 close above the EMA, followed by a successful breakout and retest, could strengthen the case for further upside.
⚠️ Bearish Scenario:
Rejection at resistance and a break below the right shoulder could signal renewed selling pressure.
One more factor deserves attention: upcoming Federal Reserve and Bank of Japan decisions could increase volatility and create sharp moves in USD/JPY.
My takeaway: A promising technical setup is not the same as a confirmed trade. Price action, risk management, and macroeconomic context must work together.
The key question is whether buyers can turn this recovery into a sustainable reversal.
What is your view on USD/JPY? Are we seeing the beginning of a bullish reversal, or is this just a temporary pullback within a broader downtrend?
#USDJPY #ForexTrading #TechnicalAnalysis #PriceAction #RiskManagement #ForexMarket
تحديثات الكاتب
المزيد من Trader
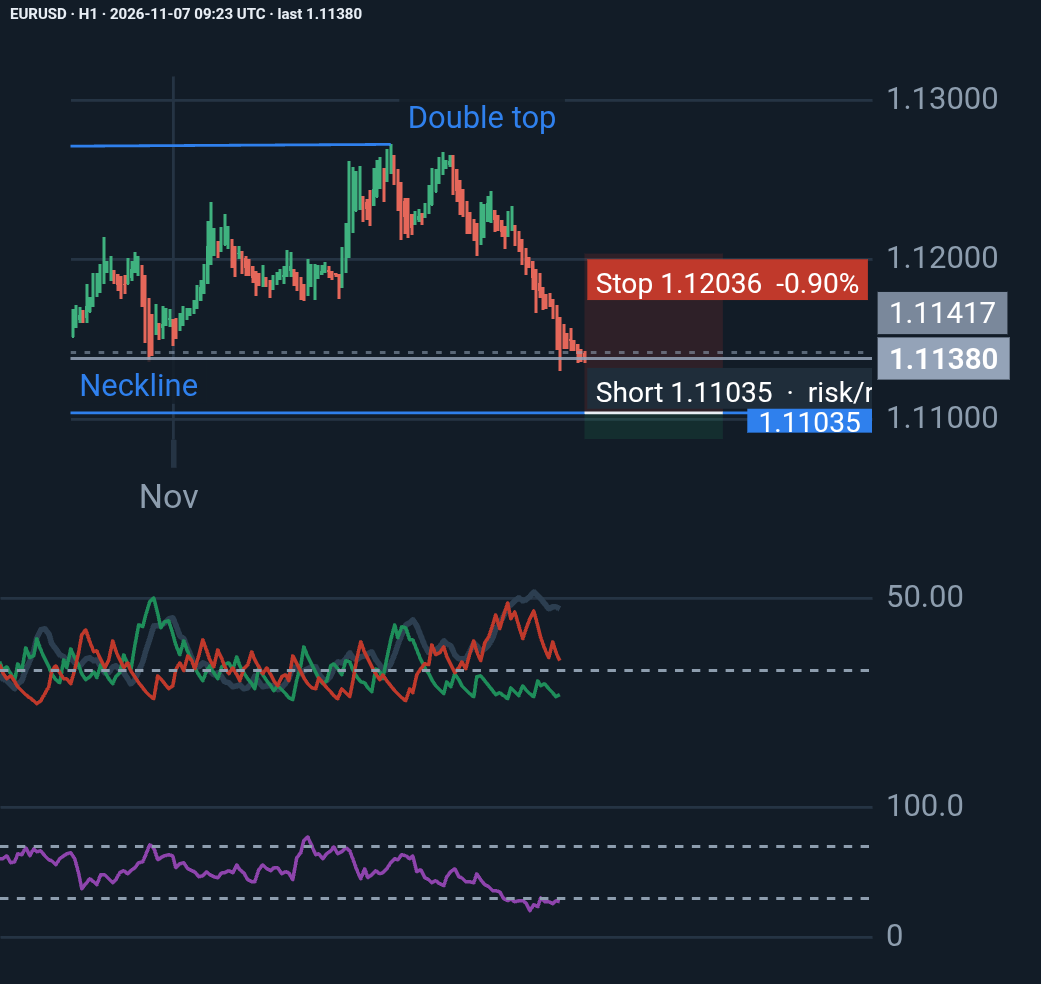
EURUSD H1: Bears Remain in Control, but Is a Reversal Approaching?
EURUSD remains under strong bearish pressure, with ADX at 45.88 and -DI (24.08) significantly above +DI (10.21). RSI at 27.06 signals oversold conditions, raising the possibility …
Trader
منذ 1 day, 17 hours
♥ 0 💬 0
السعر منذ النشر: +0.14% · لصالح الفكرة
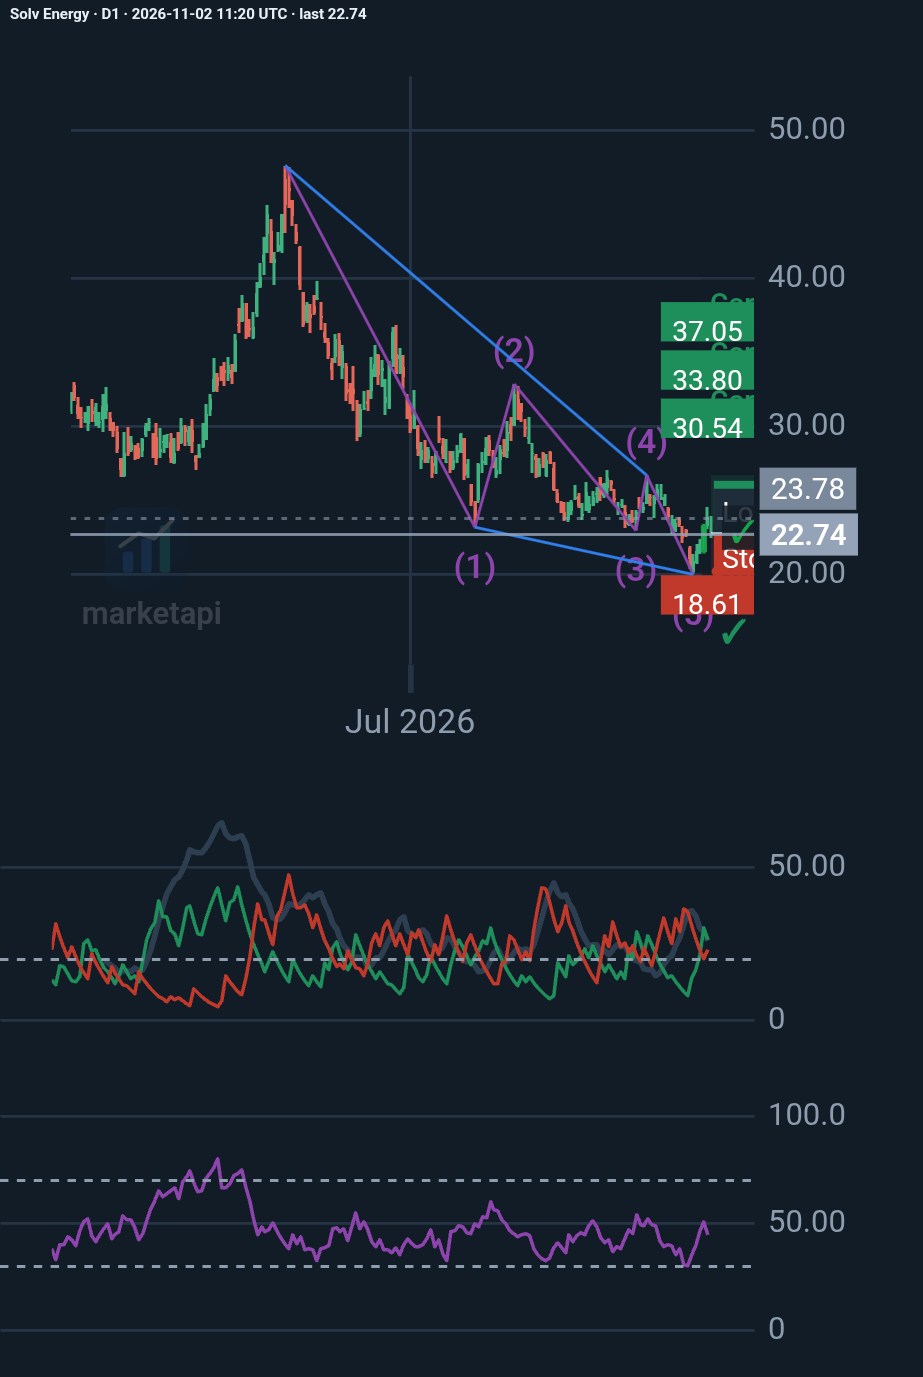
SOLV Energy (NASDAQ: MWH): A bullish reversal on the horizon?
My D1 analysis identifies a potential Elliott Wave ending diagonal, suggesting the prolonged decline may be approaching exhaustion. Key levels: • $19.99 – Critical support • $23.9…
Trader
منذ 6 days, 15 hours
♥ 0 💬 0
السعر منذ النشر: +10.73% · لصالح الفكرة
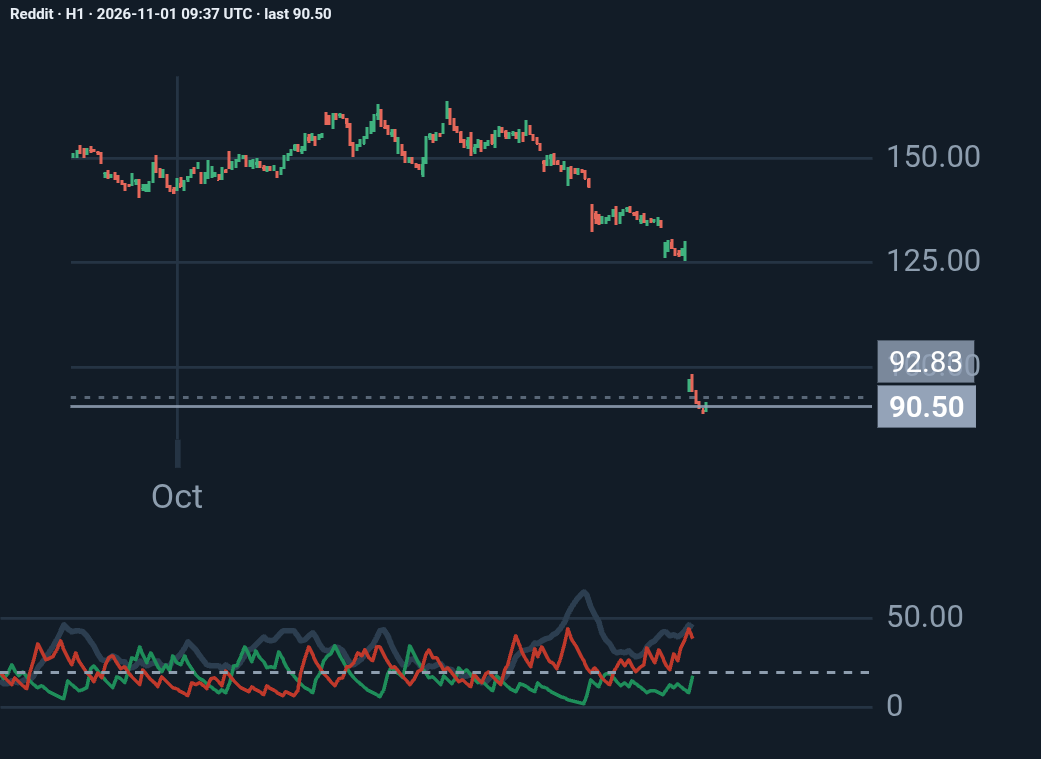
Reddit H1: my analysis
Reddit lost about 30% of its market value on October 30, 2026, the day after its third-quarter earnings, because it admitted that traffic arriving from Google search has dropped si…
Trader
منذ 1 week
♥ 0 💬 0
السعر منذ النشر: +3.69%
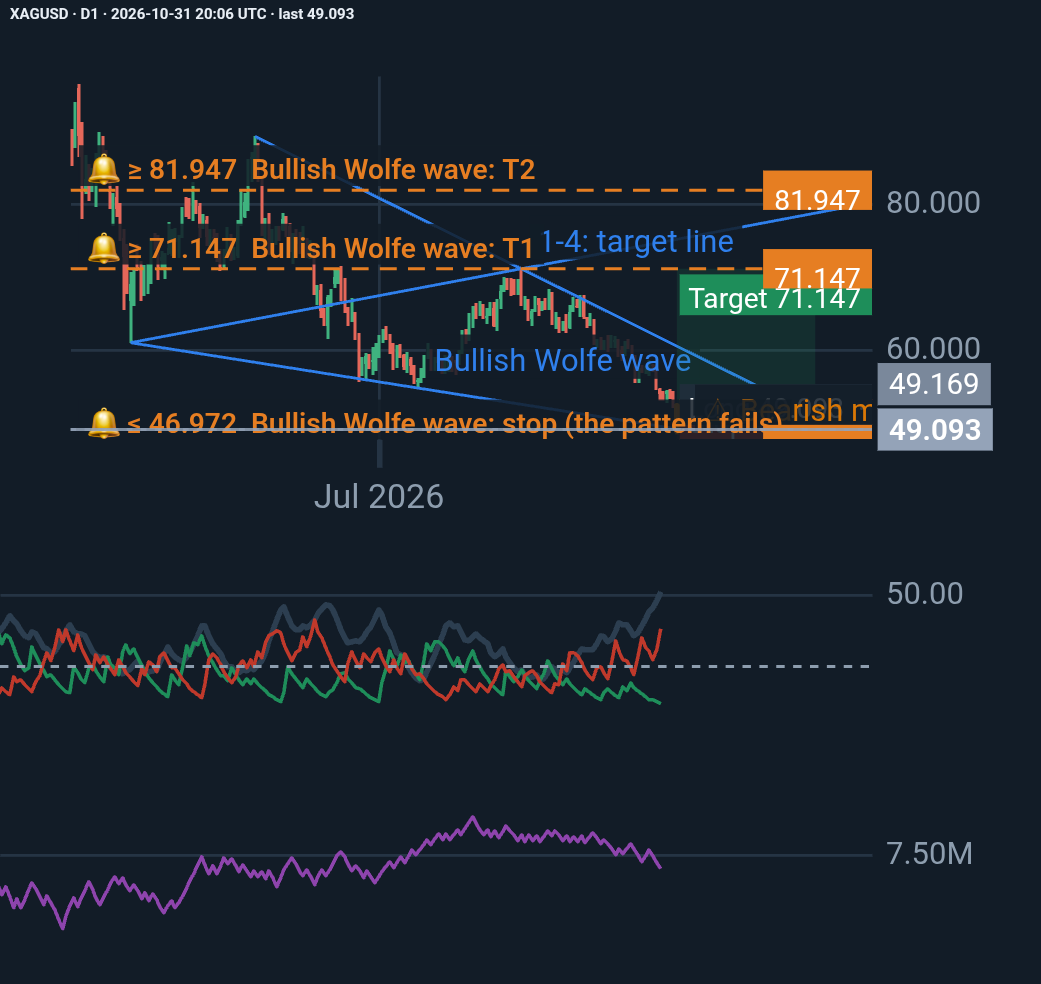
Silver (XAGUSD) – A Potential Bullish Reversal at a Critical Technical Zone
Silver has experienced a significant daily decline, with the latest session closing at 49.093, almost exactly at the projected Point 5 of a bullish Wolfe Wave pattern. Despite str…
Trader
منذ 1 week, 1 day
♥ 0 💬 0
السعر منذ النشر: +8.02%
الأفكار رأي كاتبها وليست نصيحة استثمارية. التحركات السابقة لا تتنبأ بالمستقبلية.
التعليقات 0
سجّل الدخول أو أنشئ حسابًا مجانيًا لتعجب وتتابع وتعلّق.