
Corning D1 analysis
 Trader @trader
25 Oct 2026, 16:40 UTC
 افتح على الرسم البياني المباشر ↗
السعر عند النشر: 122.670000 · الآن 105.260000 (-14.19%، عكس الفكرة)
Corning Inc. (GLW) | Daily Chart Analysis: A Potential Bullish Reversal?
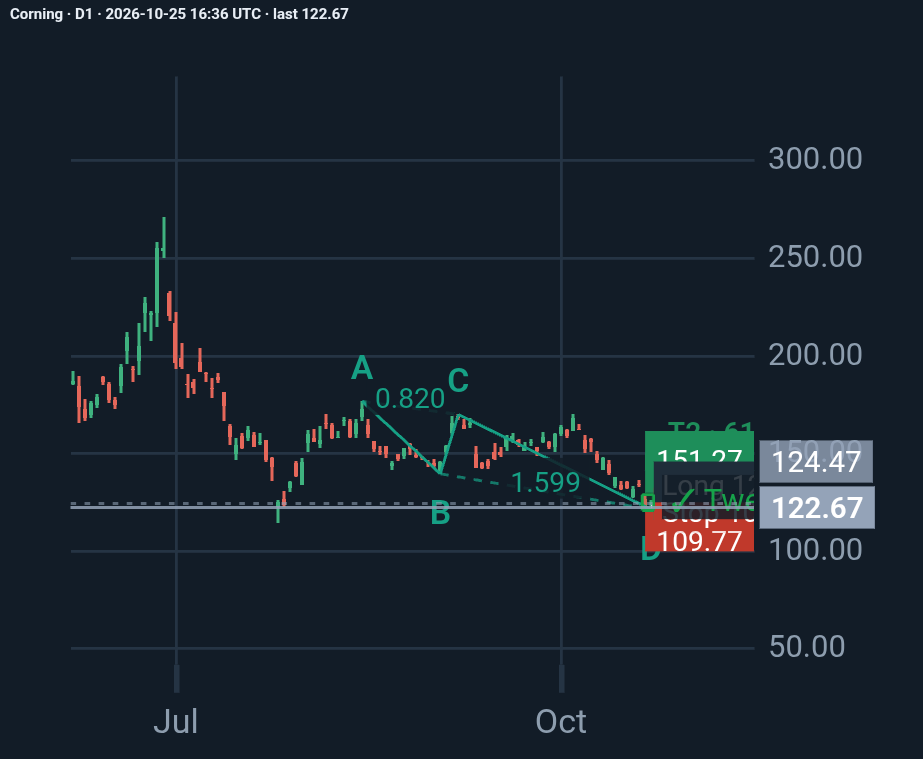
Corning is approaching an important technical decision point, with a potential bullish AB=CD harmonic pattern forming near the $121 area.
Based on the latest available daily chart data, GLW closed at $122.67 on October 22, 2026, after reaching an intraday low of $121.20.
Here are the key technical levels and scenarios I’m watching:
• Potential reversal zone: $120.64–$121.20
• First upside target: $139.78
• Second upside target: $151.27
• Proposed risk-management levels: $109.02–$109.77
The bullish AB=CD pattern has a reported quality score of 91/100 from the pattern-analysis tool. Its historical backtest also reports a 56% rate of reaching the first target before the stop across 1,274 trades. These statistics are encouraging, but they do not guarantee the outcome of this particular setup.
A potential tweezer bottom adds to the reversal thesis, although the underlying candle data should be verified before treating it as confirmed.
What would strengthen the bullish case?
A sustained hold above the $120–$121 support region, followed by a recovery above $128.79, would provide additional evidence that buyers are regaining control. A break above the $139–$140 resistance zone could open the way toward $151.27.
What could invalidate the setup?
A decisive breakdown below the recent low would weaken the reversal thesis. The proposed stop region near $109–$110 represents a deeper risk-control level, not a guarantee against losses.
One additional factor deserves attention: Corning's scheduled earnings release on October 27 could introduce significant volatility and gap risk.
My view: GLW presents an interesting potential reversal opportunity, but confirmation matters more than the pattern itself. Price action around support, resistance, and the upcoming earnings announcement will be critical.
Technical analysis is about probabilities, risk management, and disciplined execution—not certainty.
What is your view on GLW? Will buyers defend the $121 area and push toward $140, or is another leg lower more likely?
#Corning #GLW #TechnicalAnalysis #StockMarket #HarmonicPatterns #PriceAction #Trading #RiskManagement
تحديثات الكاتب
المزيد من Trader
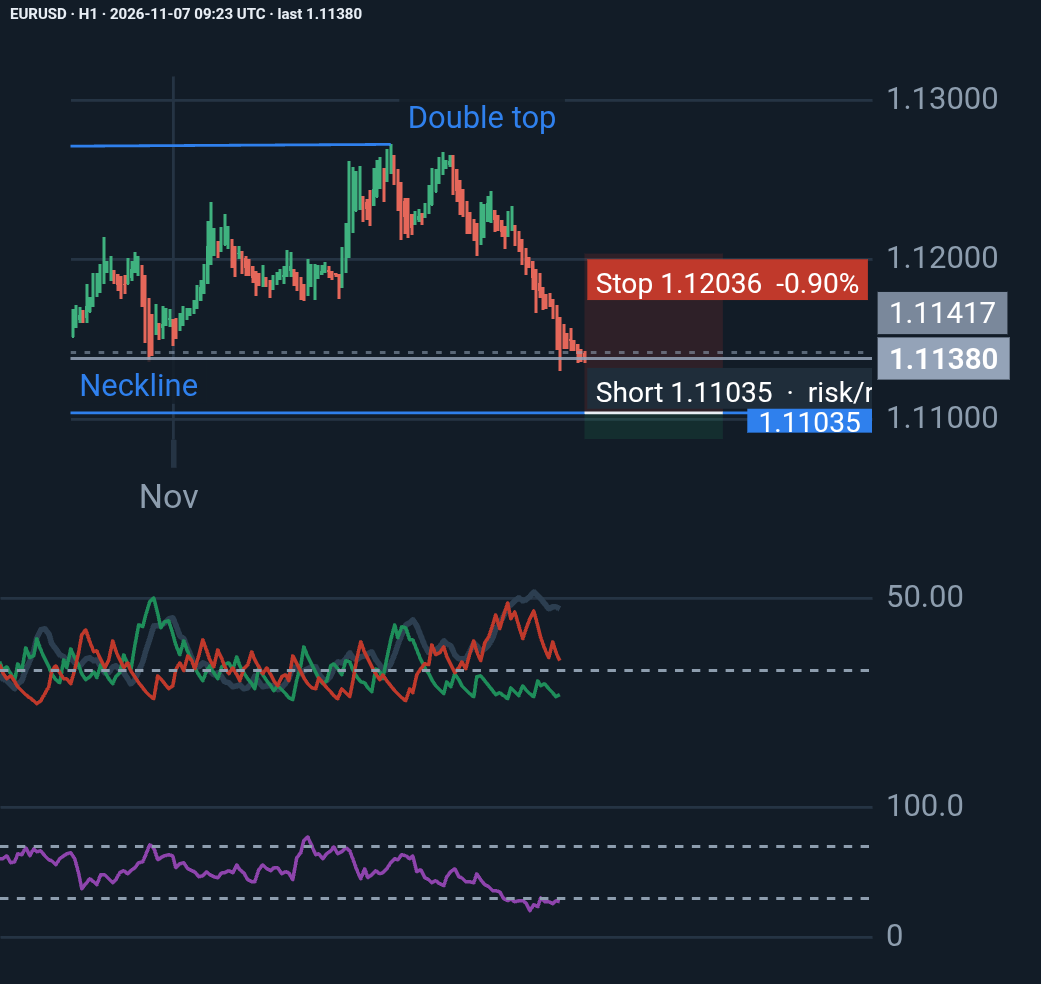
EURUSD H1: Bears Remain in Control, but Is a Reversal Approaching?
EURUSD remains under strong bearish pressure, with ADX at 45.88 and -DI (24.08) significantly above +DI (10.21). RSI at 27.06 signals oversold conditions, raising the possibility …
Trader
منذ 1 day, 14 hours
♥ 0 💬 0
السعر منذ النشر: +0.11% · لصالح الفكرة
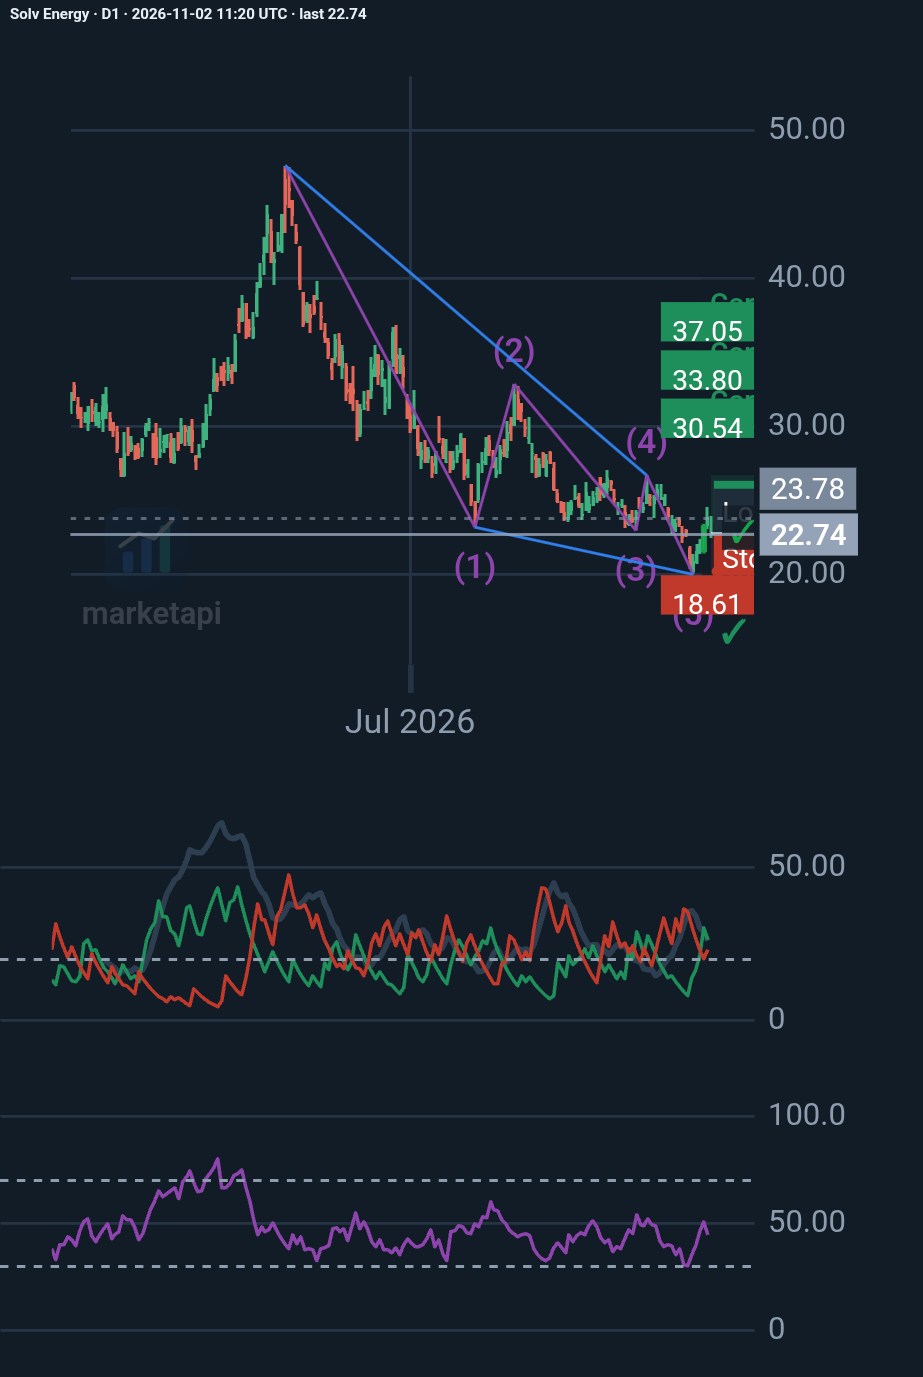
SOLV Energy (NASDAQ: MWH): A bullish reversal on the horizon?
My D1 analysis identifies a potential Elliott Wave ending diagonal, suggesting the prolonged decline may be approaching exhaustion. Key levels: • $19.99 – Critical support • $23.9…
Trader
منذ 6 days, 12 hours
♥ 0 💬 0
السعر منذ النشر: +10.73% · لصالح الفكرة
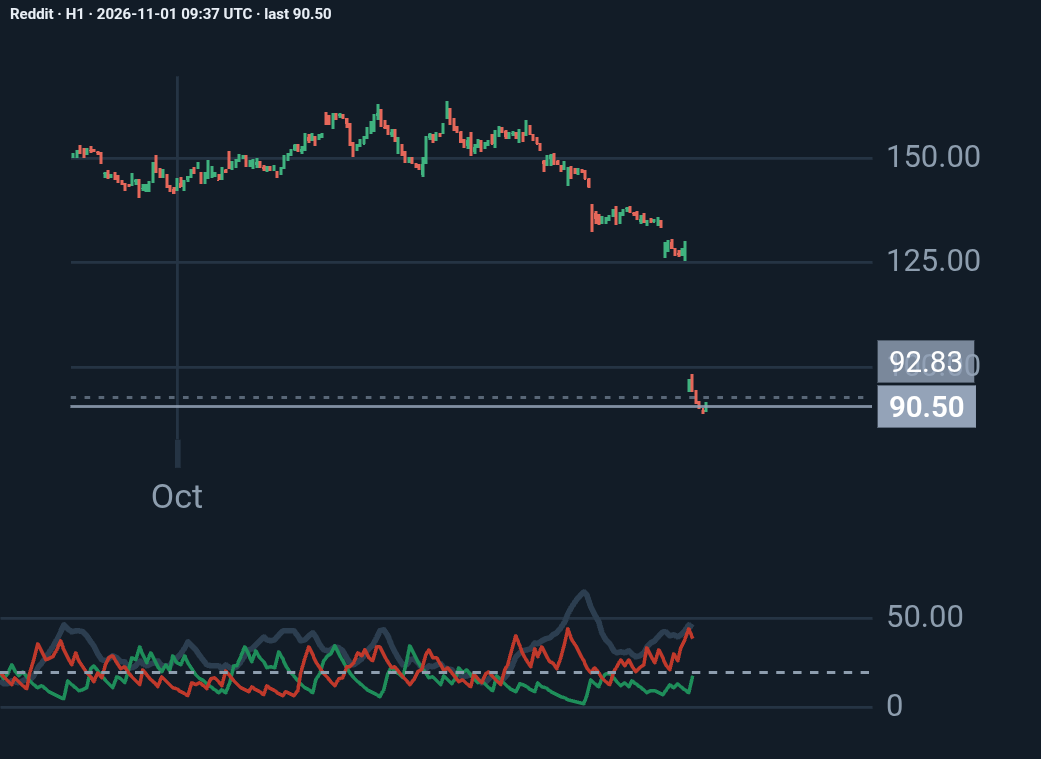
Reddit H1: my analysis
Reddit lost about 30% of its market value on October 30, 2026, the day after its third-quarter earnings, because it admitted that traffic arriving from Google search has dropped si…
Trader
منذ 1 week
♥ 0 💬 0
السعر منذ النشر: +3.69%
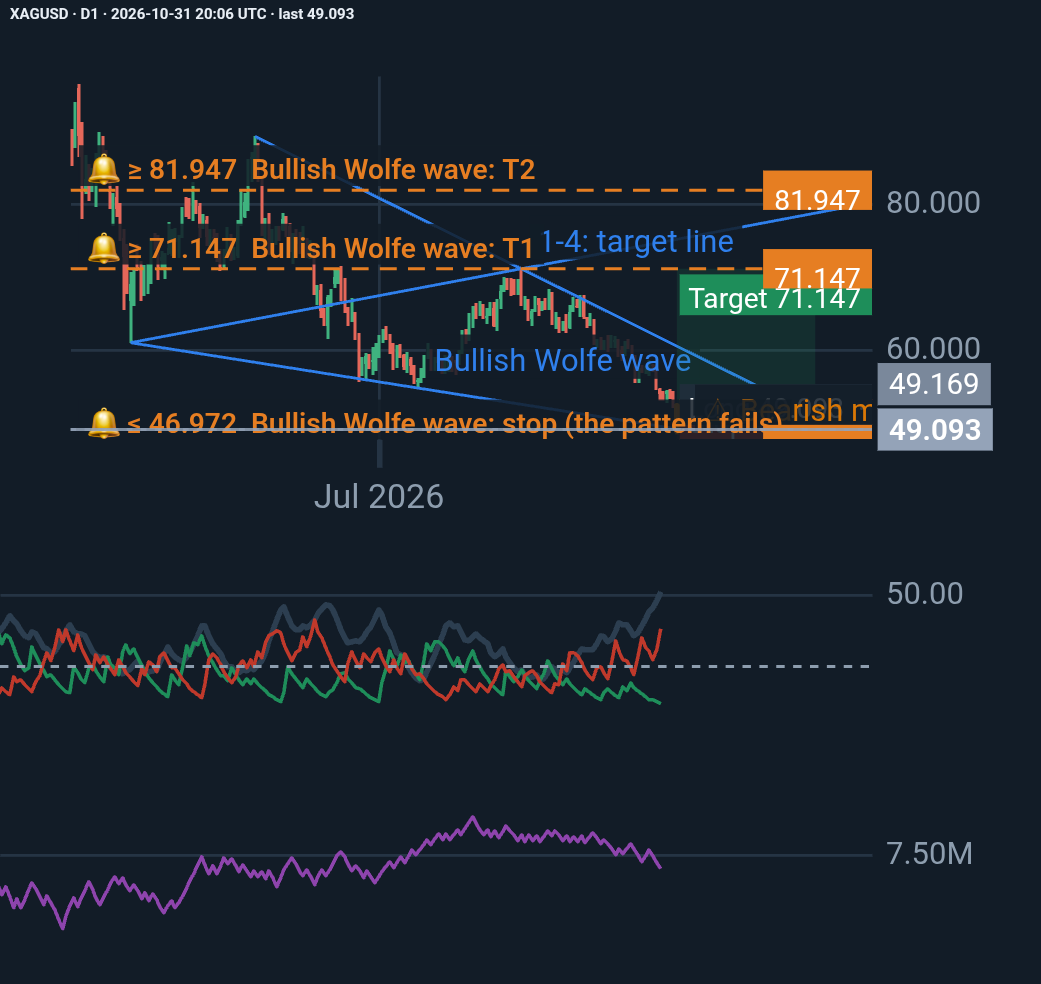
Silver (XAGUSD) – A Potential Bullish Reversal at a Critical Technical Zone
Silver has experienced a significant daily decline, with the latest session closing at 49.093, almost exactly at the projected Point 5 of a bullish Wolfe Wave pattern. Despite str…
Trader
منذ 1 week, 1 day
♥ 0 💬 0
السعر منذ النشر: +6.11%
الأفكار رأي كاتبها وليست نصيحة استثمارية. التحركات السابقة لا تتنبأ بالمستقبلية.
التعليقات 0
سجّل الدخول أو أنشئ حسابًا مجانيًا لتعجب وتتابع وتعلّق.