
AmericanTower D1 analysis
 Trader @trader
23 Oct 2026, 18:46 UTC
 افتح على الرسم البياني المباشر ↗
السعر عند النشر: 188.080000 · الآن 188.140000 (+0.03%)
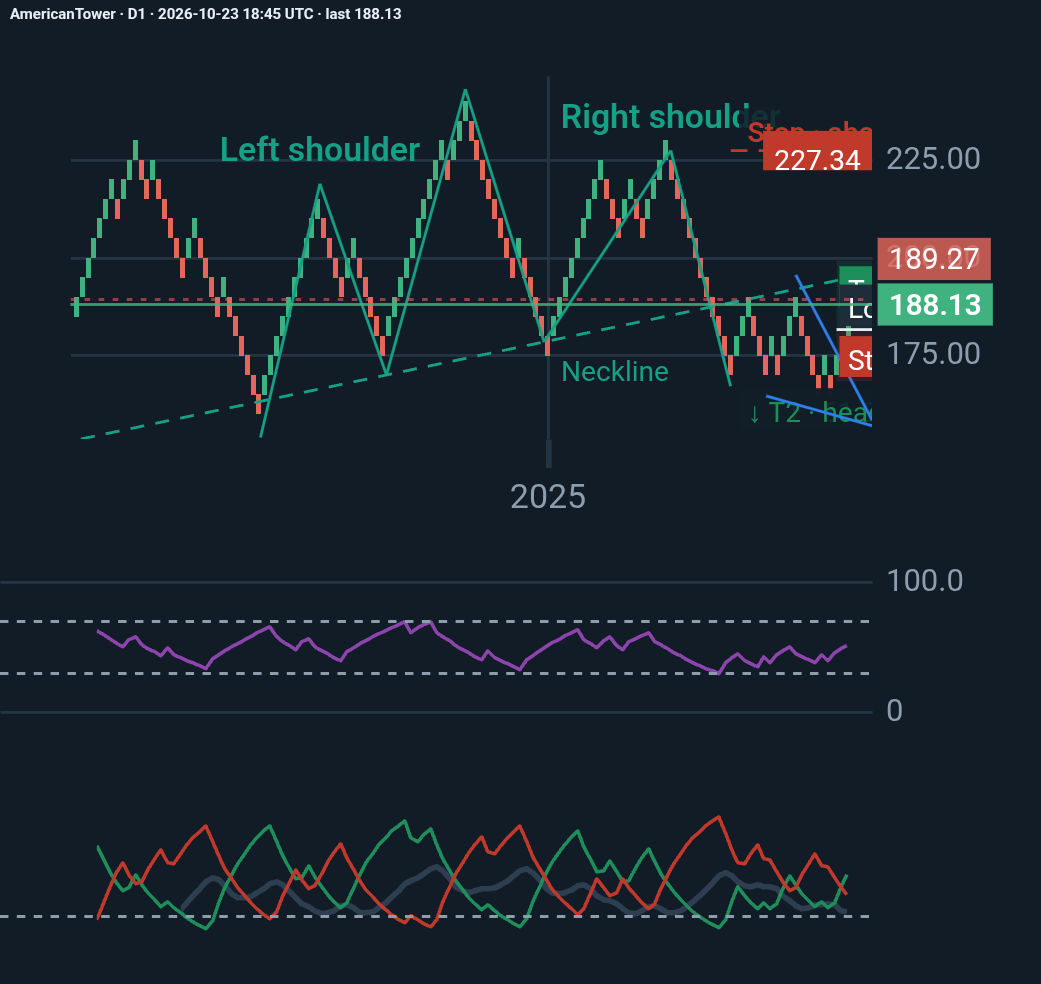
American Tower (AMT): A recovery within a potentially bearish structure.
American Tower is showing improving short-term momentum, but the broader technical picture remains uncertain.
On the daily chart, RSI stands near 64, while ADX at 34.10 and +DI at 49.56 versus -DI at 14.49 indicate strong bullish directional momentum.
However, price has not clearly reclaimed the neckline of the previously identified head-and-shoulders pattern. Improving momentum does not automatically invalidate a larger bearish structure.
Key levels to watch: • $188–190: Near-term resistance • $195.52: Major range resistance • $178–180: Support zone • $168–170: Critical structural support
A sustained breakout above resistance would strengthen the recovery scenario. Conversely, renewed selling below support could reopen downside risks.
My takeaway: AMT is recovering, but confirmation is still needed. Price action around key levels matters more than relying on indicators in isolation.
#AmericanTower #TechnicalAnalysis #StockMarket #Trading #Investing
تحديثات الكاتب
المزيد من Trader
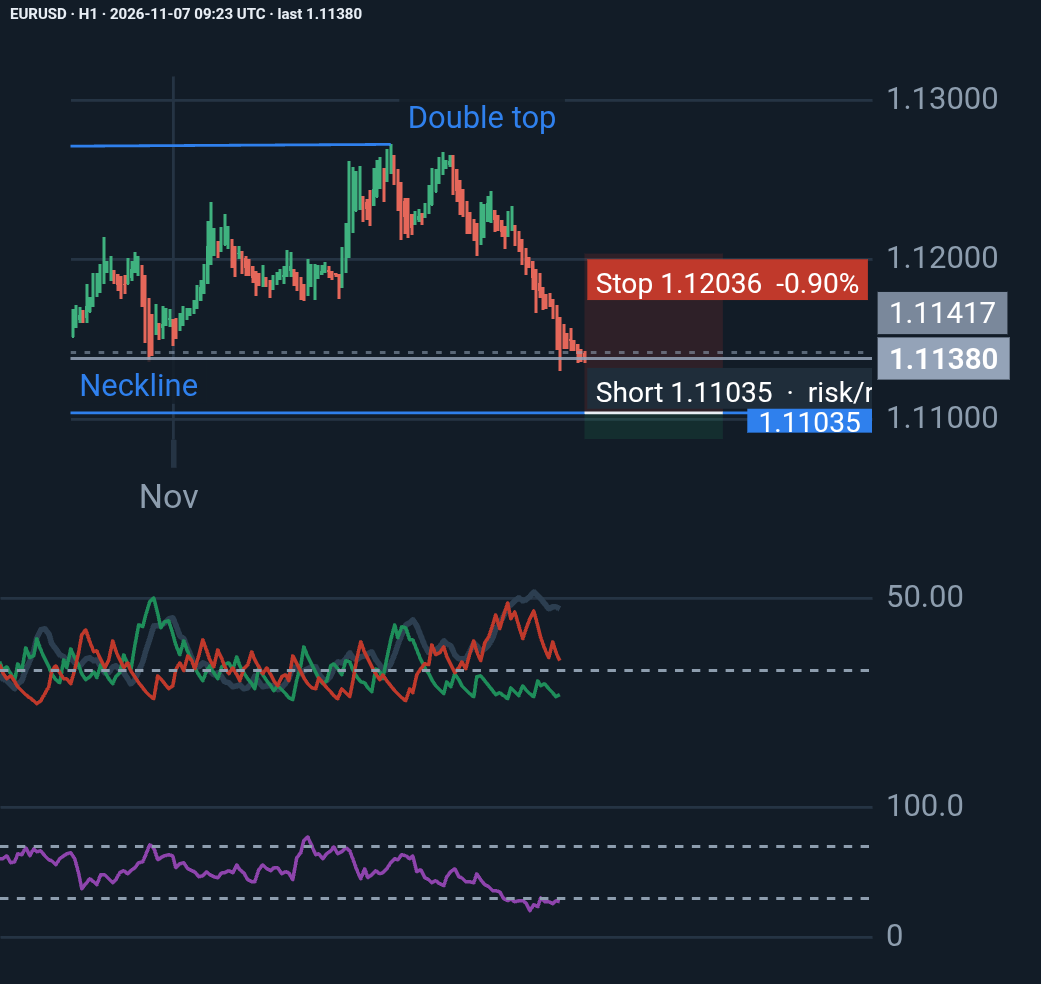
EURUSD H1: Bears Remain in Control, but Is a Reversal Approaching?
EURUSD remains under strong bearish pressure, with ADX at 45.88 and -DI (24.08) significantly above +DI (10.21). RSI at 27.06 signals oversold conditions, raising the possibility …
Trader
منذ 1 day, 15 hours
♥ 0 💬 0
السعر منذ النشر: +0.09% · لصالح الفكرة
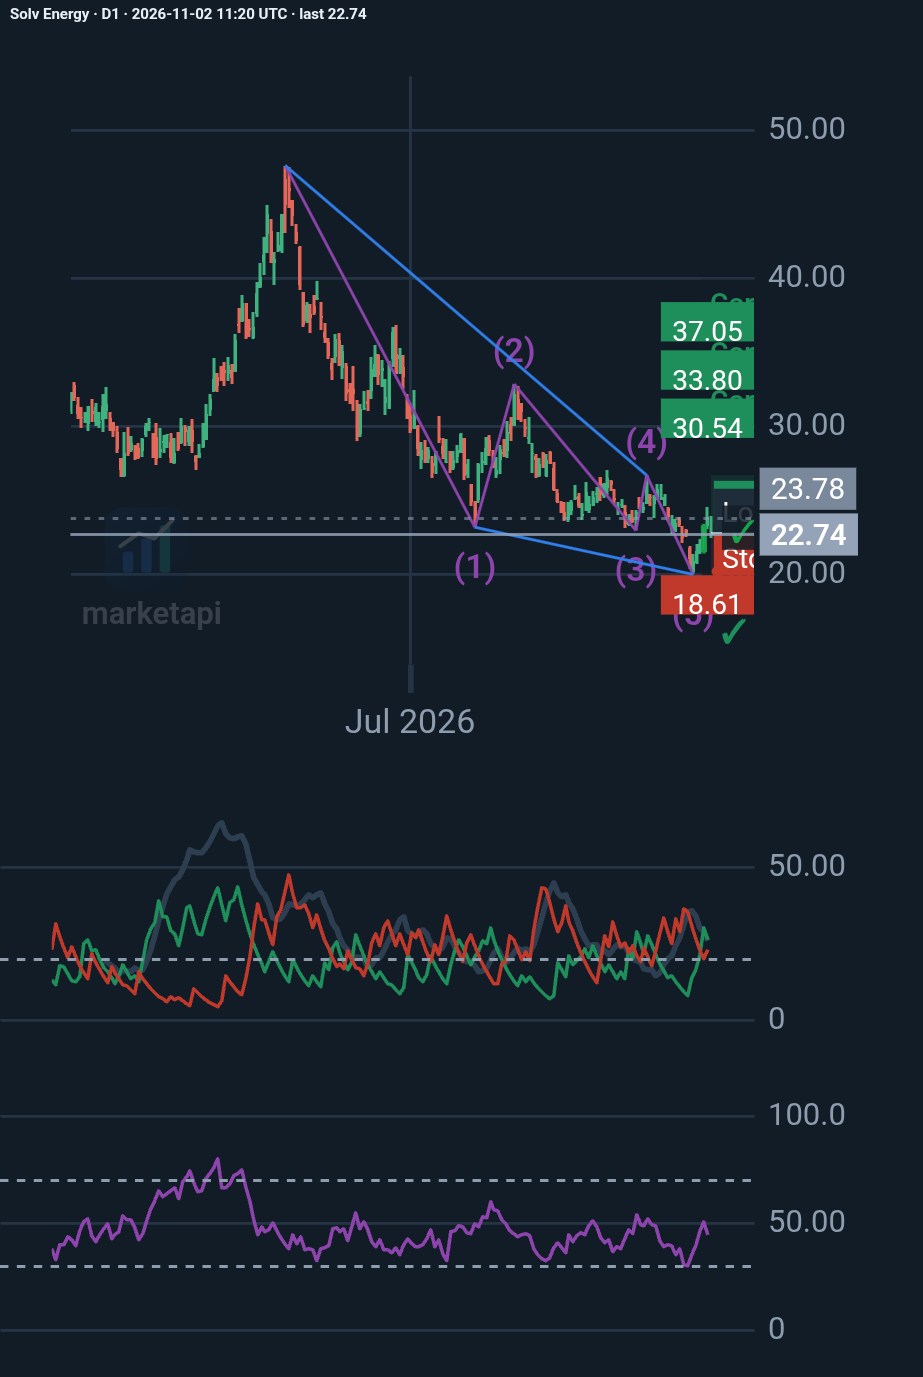
SOLV Energy (NASDAQ: MWH): A bullish reversal on the horizon?
My D1 analysis identifies a potential Elliott Wave ending diagonal, suggesting the prolonged decline may be approaching exhaustion. Key levels: • $19.99 – Critical support • $23.9…
Trader
منذ 6 days, 13 hours
♥ 0 💬 0
السعر منذ النشر: +10.73% · لصالح الفكرة
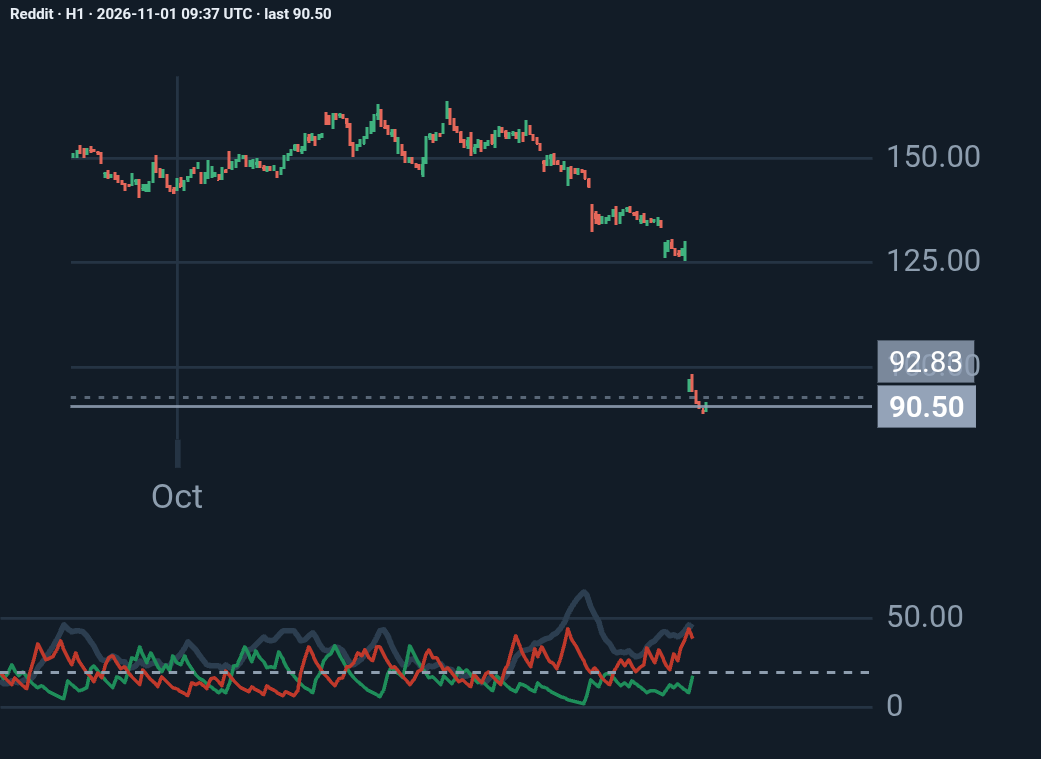
Reddit H1: my analysis
Reddit lost about 30% of its market value on October 30, 2026, the day after its third-quarter earnings, because it admitted that traffic arriving from Google search has dropped si…
Trader
منذ 1 week
♥ 0 💬 0
السعر منذ النشر: +3.69%
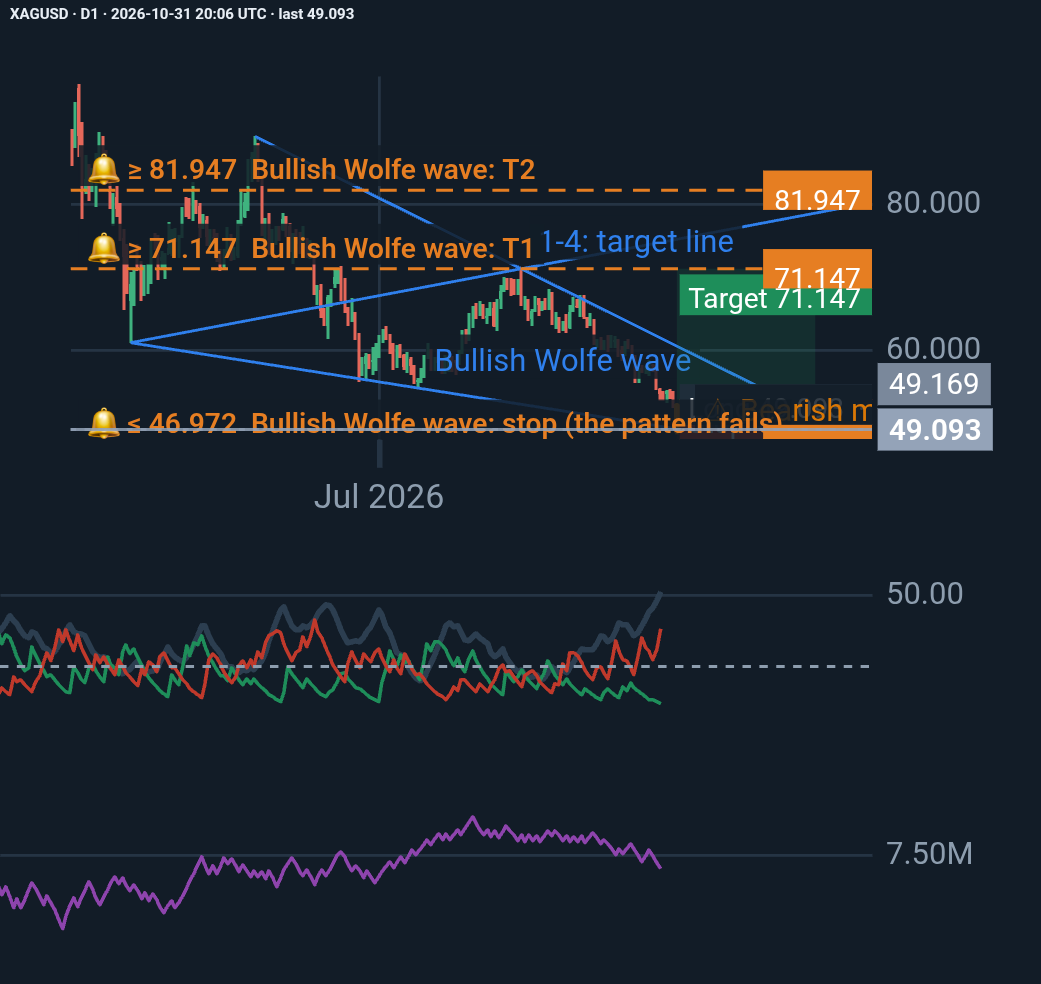
Silver (XAGUSD) – A Potential Bullish Reversal at a Critical Technical Zone
Silver has experienced a significant daily decline, with the latest session closing at 49.093, almost exactly at the projected Point 5 of a bullish Wolfe Wave pattern. Despite str…
Trader
منذ 1 week, 1 day
♥ 0 💬 0
السعر منذ النشر: +7.68%
الأفكار رأي كاتبها وليست نصيحة استثمارية. التحركات السابقة لا تتنبأ بالمستقبلية.
التعليقات 0
سجّل الدخول أو أنشئ حسابًا مجانيًا لتعجب وتتابع وتعلّق.