
Coty W1 analysis
 Trader @trader
20 Oct 2026, 21:40 UTC
 Открыть на живом графике ↗
Цена при публикации: 3.160000 · сейчас 3.950000 (+25.00%, в пользу идеи)
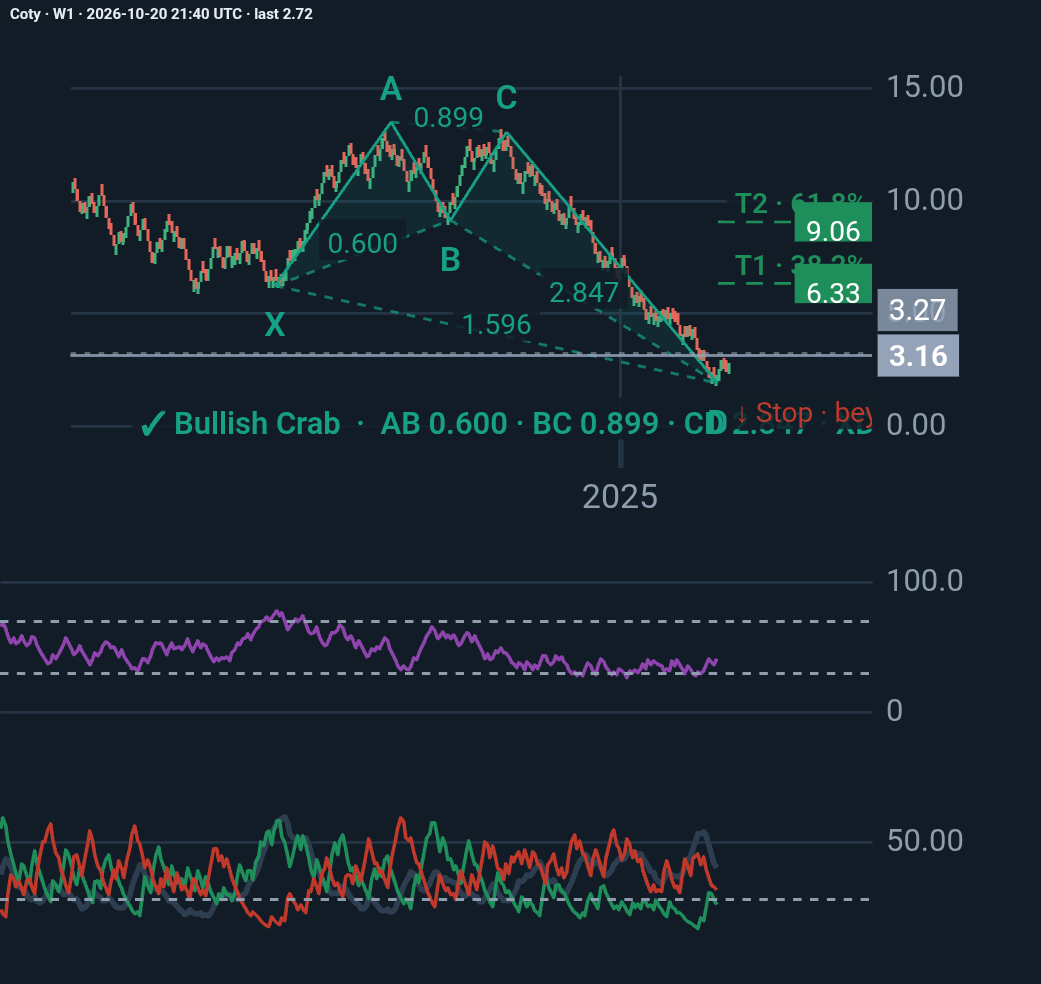
Coty’s weekly chart suggests a potential bullish recovery from the Crab harmonic completion near $1.91, with targets at $6.33 and $9.06. However, RSI at 41.19 and −DI above +DI indicate that bearish momentum remains dominant. A stronger price structure and improving momentum are needed to confirm a reversal. The proposed −$1.02 stop is impractical for a stock. Overall, the outlook is cautiously bullish for a rebound, but the long-term trend remains bearish until confirmed otherwise.
#Coty
Обновления от автора
Ещё от Trader
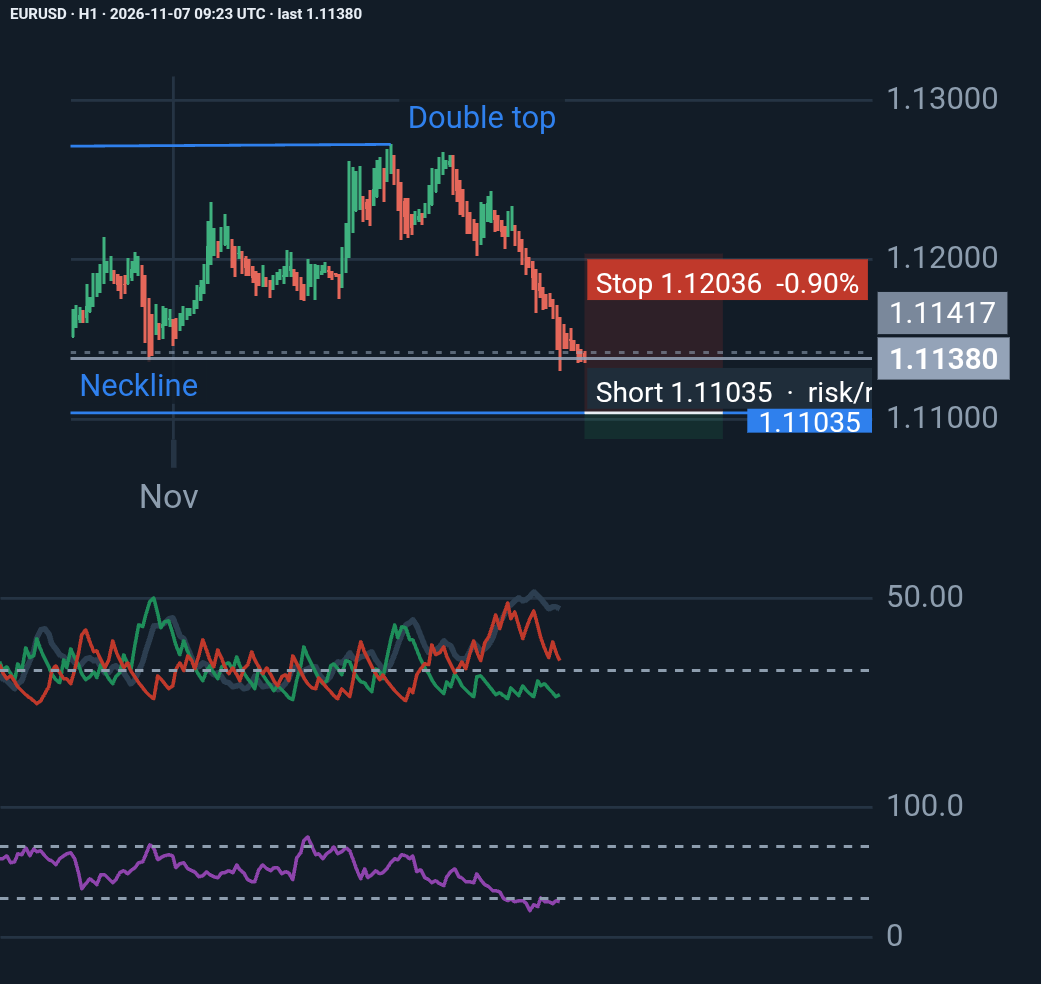
EURUSD H1: Bears Remain in Control, but Is a Reversal Approaching?
EURUSD remains under strong bearish pressure, with ADX at 45.88 and -DI (24.08) significantly above +DI (10.21). RSI at 27.06 signals oversold conditions, raising the possibility …
Trader
1 day, 15 hours назад
♥ 0 💬 0
Цена с момента публикации: +0.09% · в пользу идеи
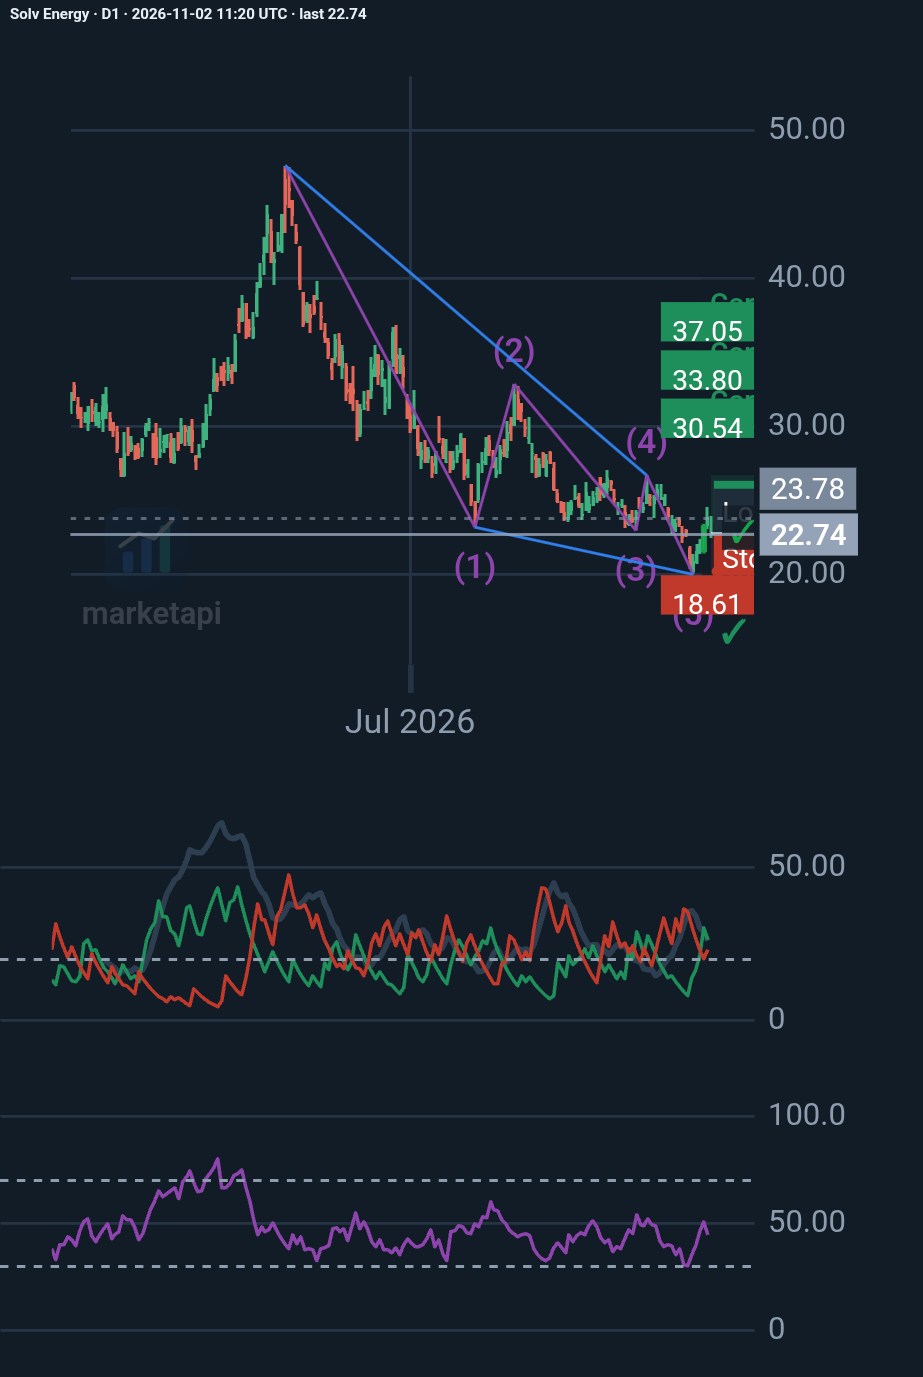
SOLV Energy (NASDAQ: MWH): A bullish reversal on the horizon?
My D1 analysis identifies a potential Elliott Wave ending diagonal, suggesting the prolonged decline may be approaching exhaustion. Key levels: • $19.99 – Critical support • $23.9…
Trader
6 days, 13 hours назад
♥ 0 💬 0
Цена с момента публикации: +10.73% · в пользу идеи
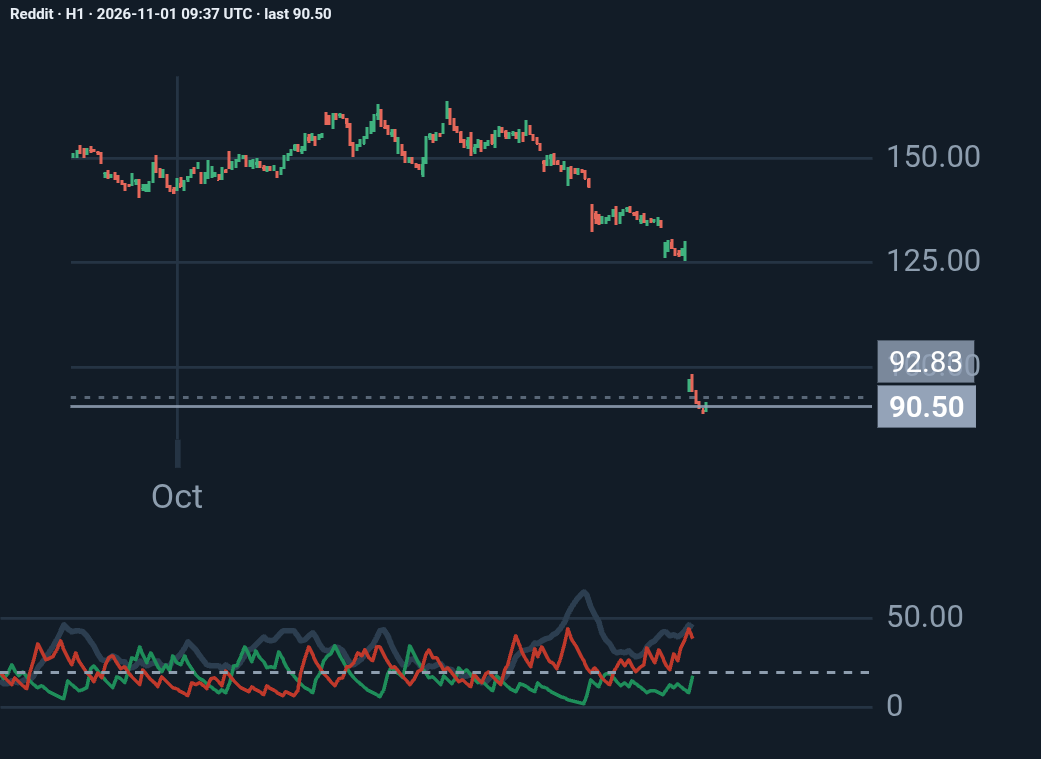
Reddit H1: my analysis
Reddit lost about 30% of its market value on October 30, 2026, the day after its third-quarter earnings, because it admitted that traffic arriving from Google search has dropped si…
Trader
1 week назад
♥ 0 💬 0
Цена с момента публикации: +3.69%
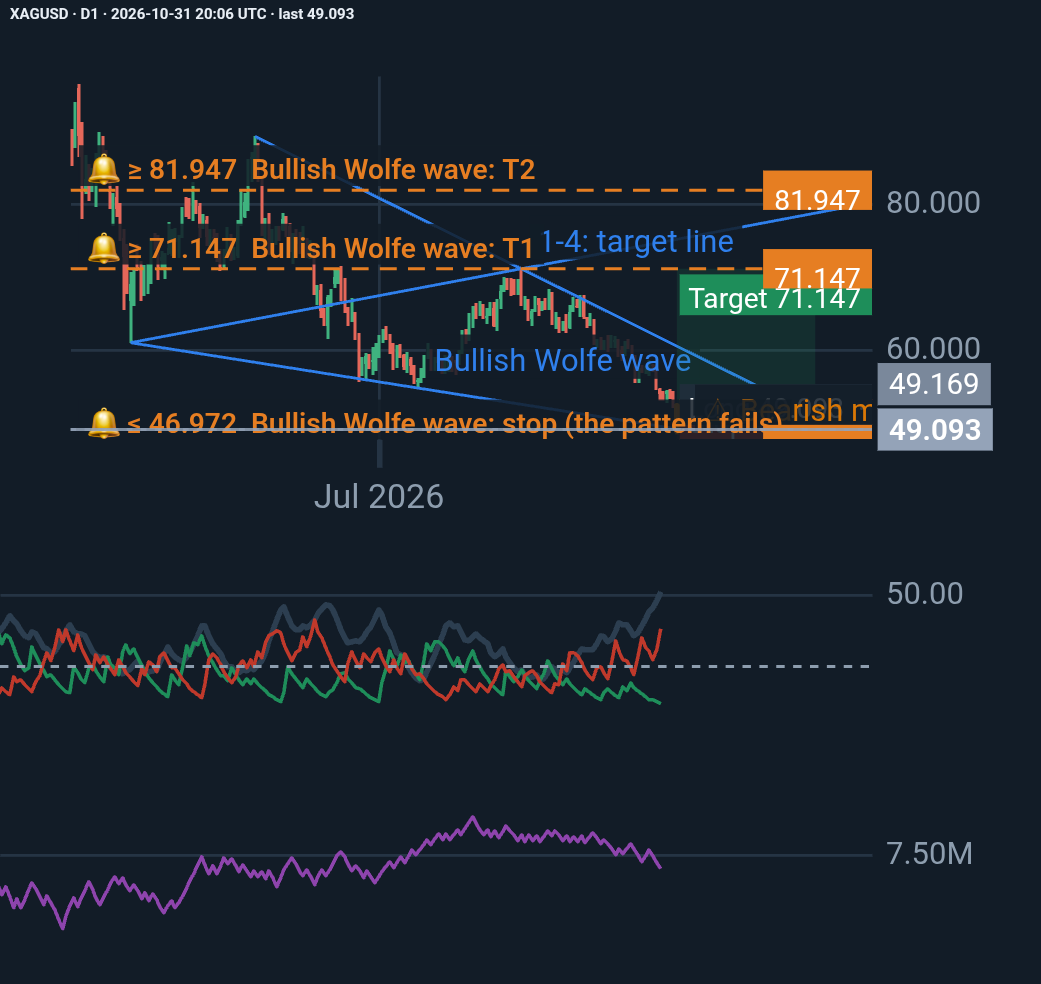
Silver (XAGUSD) – A Potential Bullish Reversal at a Critical Technical Zone
Silver has experienced a significant daily decline, with the latest session closing at 49.093, almost exactly at the projected Point 5 of a bullish Wolfe Wave pattern. Despite str…
Trader
1 week, 1 day назад
♥ 0 💬 0
Цена с момента публикации: +6.69%
Идеи — мнение автора, а не инвестиционная рекомендация. Прошлые движения не предсказывают будущие.
Комментарии 0
Войдите или создайте бесплатный аккаунт, чтобы ставить лайки, подписываться и комментировать.